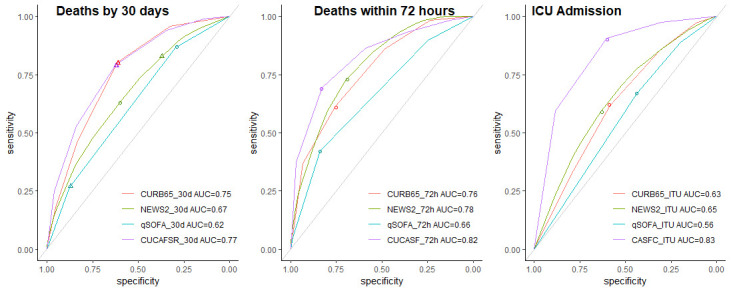
Figure 2.

Receiver operating characteristic plots for death within 72 hours and ICU admission based on the models defined as the sum of the corresponding predictors. Circles denote the sensitivity and specificity achieved by the optimal threshold from fitted models. AUC, area under the curve; CUCAF-SR, Clinical Frailty Scale, Urea, Consolidation, Age, FiO2, Sex, Respiratory rate; CUCA-SF, Clinical Frailty Scale, Urea, Consolidation, Age, SpO2, FiO2; CURB-65, Confusion, Urea, Respiratory Rate, Blood Pressure and Age Above or Below 65 Years; ICU, intensive care unit; NEWS2, National Early Warning Score 2; qSOFA, Quick Sequential (Sepsis-Related) Organ Failure Assessment.
