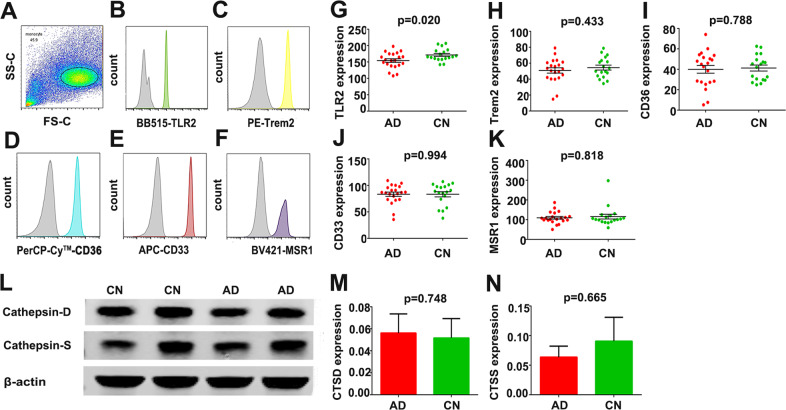
Fig. 6. Detection of Aβ1-42 uptake-related receptors and Aβ-degrading enzymes in the monocytes of AD patients.
A Following CD14-positive selection by magnetic activated cell sorting, monocytes were identified by flow cytometry by their forward-side-scatter appearance (n = 21 for AD; n = 18 for CN, mean ± SEM). B–F The expression of TLR2, TREM2, CD36, CD33 and MSR1 was assessed in monocytes, and the expression levels are depicted in representative histograms; grey curves indicate negative control staining (n = 21 for AD; n = 18 for CN, mean ± SEM; Student’s t test, two sided). G The expression level of TLR2 was decreased in AD patients compared with CN subjects (n = 21 for AD; n = 18 for CN, mean ± SEM; Student’s t test, two sided). H–K There was no significant difference between AD patients and CN controls in the expression levels of TREM2, CD36, CD33 and MSR1 (n = 21 for AD; n = 18 for CN, mean ± SEM; Mann–Whitney test or Student’s t test, two sided). I–M There was no significant difference between AD patients and CN controls in the expression levels of Aβ-degrading enzymes, including cathepsin D and cathepsin S (n = 12 for AD; n = 12 for CN, mean ± SEM; Mann–Whitney test or Student’s t test, two sided). AD Alzheimer’s disease, CN cognitively normal control, Aβ amyloid β-protein, TLR2 Toll-like receptor 2, TREM2 triggering receptor expressed on myeloid cells 2, SCARA1 macrophage scavenger receptor 1.

