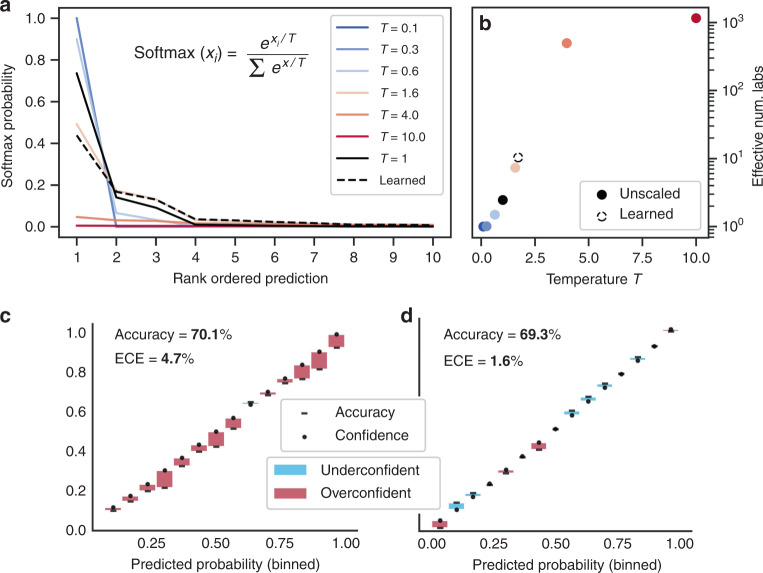
Fig. 2. Model calibration and improvement with temperature scaling.
a The effect of temperature scaling on the top ten predictions of a randomly selected plasmid from the validation set’s predicted logits. The temperature parameter divides the class logits in the softmax, increasing (higher temperature) or decreasing (lower temperature) entropy of predictions. T = 1 corresponds to default logits without temperature scaling. b Effective number of labs, exp(entropy), for the same random example as (a) as a function of temperature scaling parameter T with the unscaled default in black and the value of T learned by the temperature scaling calibration procedure shown in dotted outline. c Reliability diagram, pre-calibration. Every prediction in the test set is binned by predicted probability into 15 bins (x axis). Plotted for each bin is the model’s predicted probability, or the confidence (dot) and the percentage of the time the model was correct within that bin, or the accuracy (dash). Difference between accuracy and confidence is shown with a shaded bar, red indicating confidence > accuracy, blue indicating confidence < accuracy. For a perfectly calibrated model, the accuracy and confidence would be equal within each bin. Overall prediction accuracy across all the bins and ECE are shown. d Same as (a) but after temperature scaling re-calibration.

