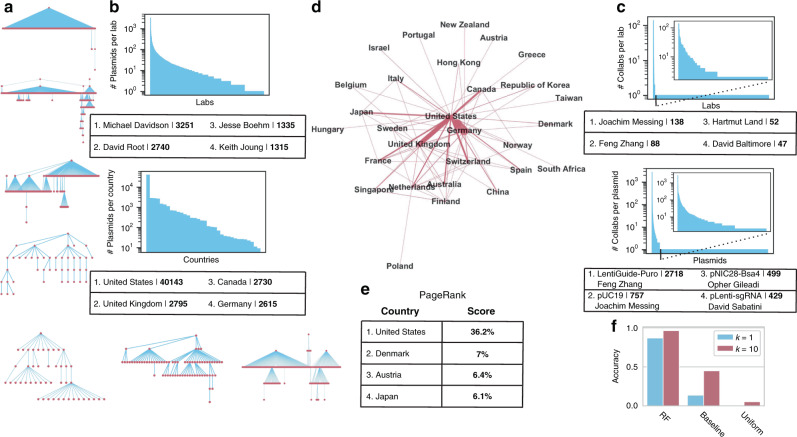
Fig. 4. Lineage networks reveal skewed distributions in Addgene deposits and facilitate ancestor lab attribution with simple machine-learning models.
a Example ancestry-descendent lineages inferred from Addgene plasmid data. The largest lineage top, followed next down by the largest diameter, followed by a collection of examples from the more complex lineages. b Number of deposits. Above, the number of plasmids deposited per lab, with ranked labs (descending) on the x axis and log10 of the number of plasmids deposited on the y axis. Top contributing labs in the table. Below, the number of deposits per country. c Number of ancestry-descendent connections. Above, number of ancestry-descendent linkages per lab, with most linked shown in the table as in (b). Below, a number of linkages per plasmid. For each, subpanel shows the left side of the distribution by cutting out single linkages which constitute the right tail. d Lineage network between nations. Links indicate that at least one lab in a country has a plasmid derived from the other country or vice versa. Width of the link is proportional to the number of connected labs. e Top four PageRank scores from the lineage network from (d), represented as a directed weighted graph. The score is shown here as a percentage. f Top-k accuracy predicting the ancestor lab: of a simple Random Forest (RF) model, the baseline of predicting the most abundant class(es) from the training set, and guessing uniformly randomly.

