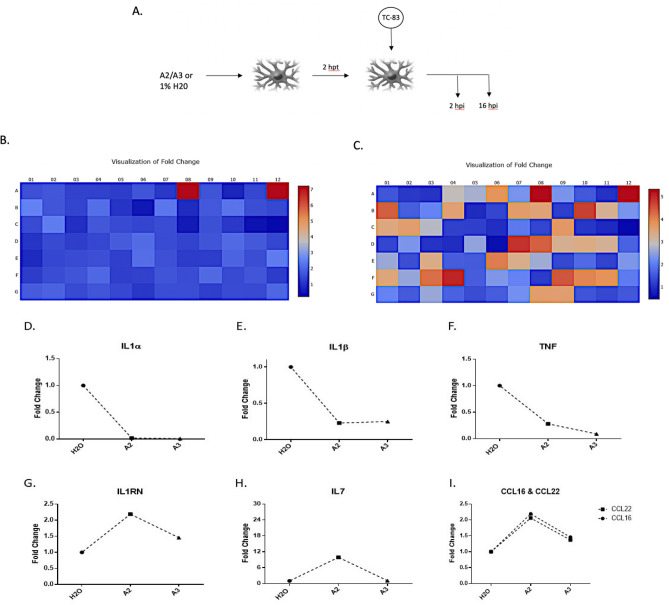
Figure 6.
A2 and A3 treatment inhibits upregulation of the inflammatory response genes following VEEV infection. (A) Schematic of peptide treatment and TC-83 infection in U87MG cells (hpt = hours post treatment; n = 1). (B) Heat maps depicting the fold change in gene expression of PCR array performed following A2 pre-treatment of infected cells compared to water control. Red is maximum increase for IL7 gene expression. (C) Heat map of gene expression in A3 treated samples. Red depicts maximum expression for BMP2 gene; Orange depicts CCL16, CCL22, and IL1RN genes; Beige depicts IL7 and VEGFA genes. Scale: Blue, decrease in gene expression; Red, increase in gene expression. (D)–(F) Decrease in the gene expression of pro-inflammatory cytokines IL1α, IL1β, and TNF respectively in peptide treated cells. (G) and (H) Increase in the expression of anti-inflammatory genes IL1RN and IL7 respectively in peptide treated cells. (I) Increase in gene expression of genes involved in chemotaxis of leukocytes, CCL22 and CCL16, as a result of peptide treatment.

