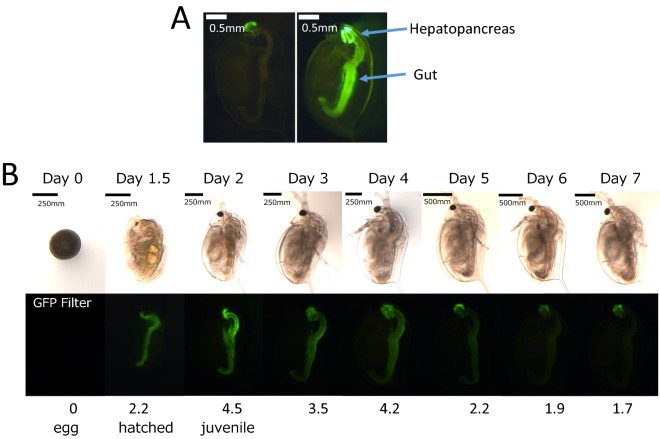
Figure 2.
Heavy metal response image of D. magna MetalloG and endogenous GFP expression of D. magna MetalloG. (A) D. magna MetalloG daphnia at 7 days old exposed to 30 μM of ZnCl2 for 48 h (right panel) and control D. magna MetalloG (unexposed) Daphnia (left panel) at the same age. (B) Eggs were obtained from D. magna MetalloG brood chamber after ovulation (assigned as Day 0) and cultured in ADaM. Pictures were taken for one week using the same parameters throughout. Bar = 250 µm. Relative fluorescence intensities were calculated by the method of Törner et al. (23) and indicated under the figures.

