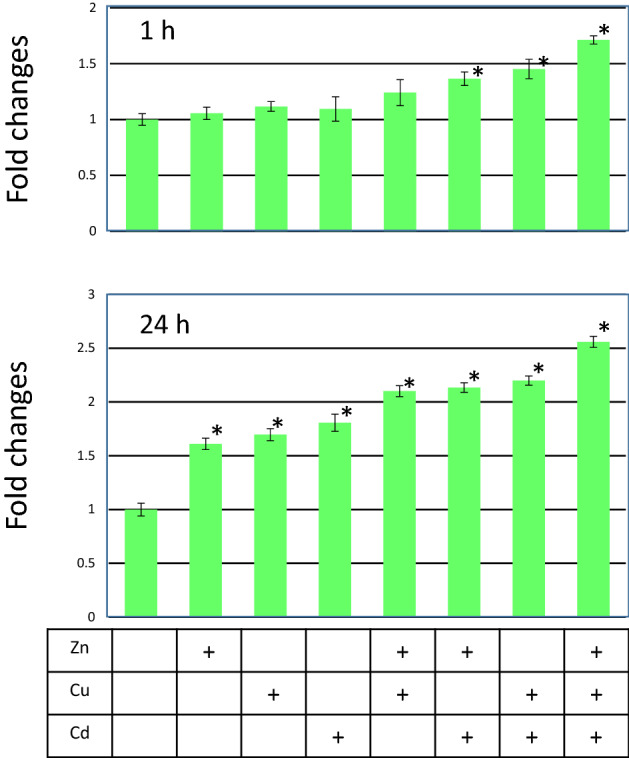
Figure 6.

GFP expression by multiple heavy metals exposure. Seven day old D. magna MetalloG was exposed to 0.9 µM of Zn2+, 20 nM of Cu2+, or 110 nM of Cd2+, and a combination of these metals. After 1 h and 24 h exposure, GFP expression was quantified, These values were divided by that of control (0 µg/L) expression level and fold changes were calculated. Metal ions used for the exposure are indicated in the boxes (+presence of ion indicated on the left column (Y-axis indicates fold changes. *p < 0.05 (t-test) Measured concentrations are indicated in Supplementary Table S5.
