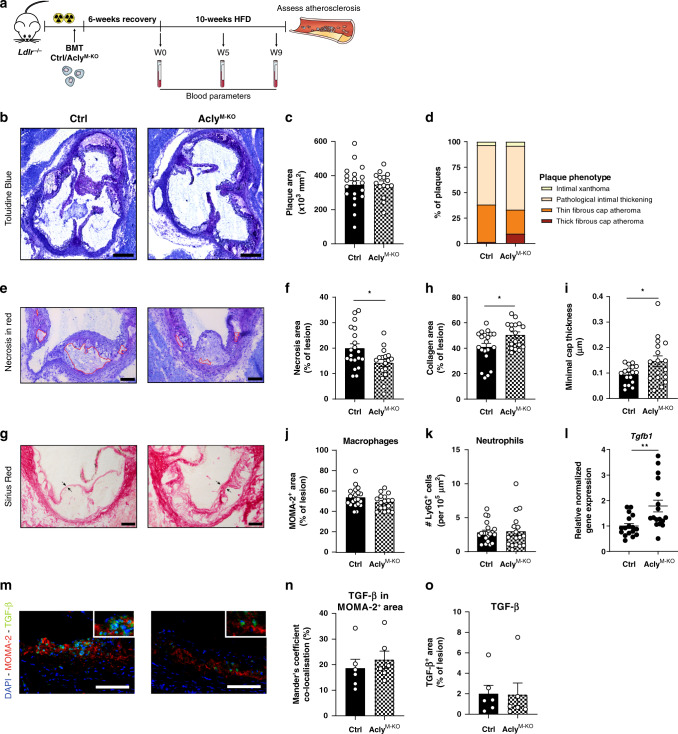
Fig. 2. Acly deletion in macrophages elicits a favorable plaque phenotype.
a In order to asses atherogenesis, bone marrow cells of either control of AclyM-KO were transplanted in lethally irritated Ldlr−/− mice. Six weeks after transplantation, mice were put on a HFD for 10 weeks. b Representative toluidine blue staining of atherosclerotic plaques within the aortic roots of control and AclyM-KO mice. Scale bar represents 500 μm. c Quantification of plaque size. d Plaque phenotypes as classified by an experimental pathologist. e Toluidine blue staining of atherosclerotic lesions with necrosis indicated in red. Scale bar represents 200 μm. f Quantification of the necrotic area. *P = 0.0173. g Sirius red staining of plaques. Scale bar represents 200 μm. h Quantification of the collagen deposition. *P = 0.0201. i Minimal cap thickness was measured at the thinnest region of the fibrotic cap surrounding the necrotic core as indicated by the arrows in g. *P = 0.0292. j Quantification of MOMA-2+ area for macrophages. k Quantification of Ly6G+area for neutrophils. l Normalized expression of Tgfb1 in aortic arches of control and AclyM-KO mice. **P = 0.0038 m Representative immunohistochemical analysis of macrophages (MOMA-2) and TGF-β in mouse plaques from control or AclyM-KO mice (n = 6/6 ctrl/KO from one experiment). Scale bar represents 100 µm. n Quantification of colocalization, percentage of TGF-β+ area in MOMA-2+ area. o Quantification of TGF-β+ area in the lesion. Values represent mean ± SEM (n = 20/17 (ctrl/KO in b–l), n = 6/6 (ctrl/KO in n, o). *P < 0.05; **P < 0.01 by two-tailed Student’s t test (f, h, i, l). Source data are provided as a Source Data file (c, d, f, h–l, m, o).

