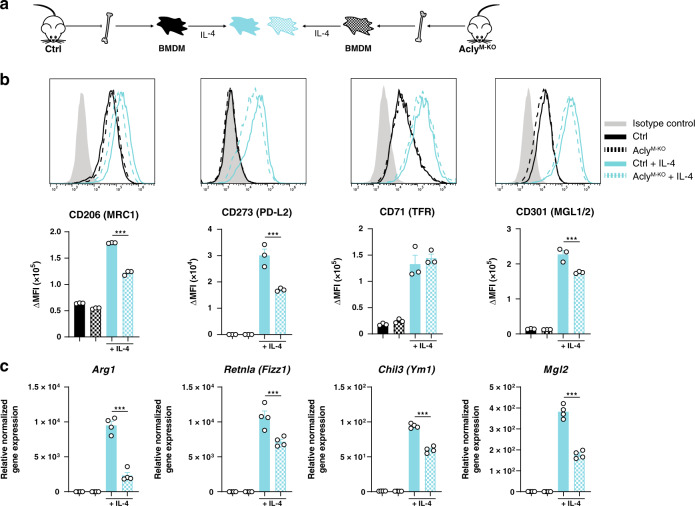
Fig. 4. IL-4 response is decreased after Acly deletion in macrophages.
a Differentiated control and AclyM-KO macrophages (BMDMs) were stimulated with IL-4. b Expression of IL-4-induced surface markers as measured by flow cytometry. Representative histograms and quantified surface expression (ΔMFI = [median fluorescence intensity]positive staining – [MFI]pooled control) are shown. CD206 ***P < 0.0001, CD273 ***P = 0.0003, CD301 ***P = 0.0008. c Relative normalized gene expression of IL-4-induced genes. Arg1 ***P < 0.0001, Retnla ***P = 0.0004, Ym1 ***P < 0.0001. Values represent mean ± SEM of n = 3 b or n = 4 c technical replicates of one out of three representative experiments. ***P < 0.001 by ordinary one-way ANOVA with Bonferroni post hoc test for multiple comparisons (b, c). Source data are provided as a Source Data file (b, c).

