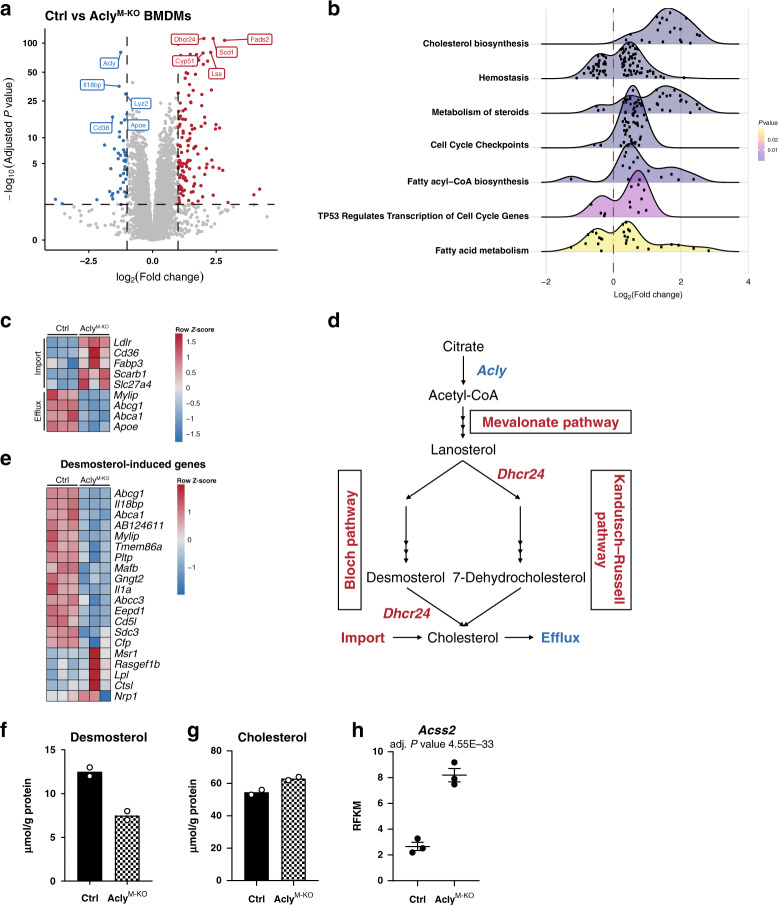
Fig. 6. AclyM-KO macrophages exhibit deregulated cholesterol biosynthesis.
a Volcano plot with up- or downregulated genes in Acly-deficient macrophages (BMDMs) highlighted in red or blue, respectively. b Ridgeline plot of significantly enriched Reactome pathways. Log2FC distributions of member genes are plotted on the x axis. Color of the distributions represents enriched pathway P value. c Expression of genes involved in import/transport of cholesterol and fatty acids, and genes that promote cholesterol efflux. d Schematic view of cholesterol metabolism and the effect of Acly deficiency (red indicating upregulation; blue downregulation). e Desmosterol levels in control and Acly-deficient macrophages. f Genes previously found to be induced by desmosterol, plotted in a heatmap for control and AclyM-KO macrophages. g Cholesterol levels in control and Acly-deficient macrophages. h Acss2 expression in control and Acly-deficient macrophages. Values represent mean from n = 2 technical replicates from three pooled mice e, g, or mean ± SEM n = 3 technical replicates from three pooled mice (h). Source data are provided as a Source Data file e, g or deposited in GSE126690 (a–d, f, h).

