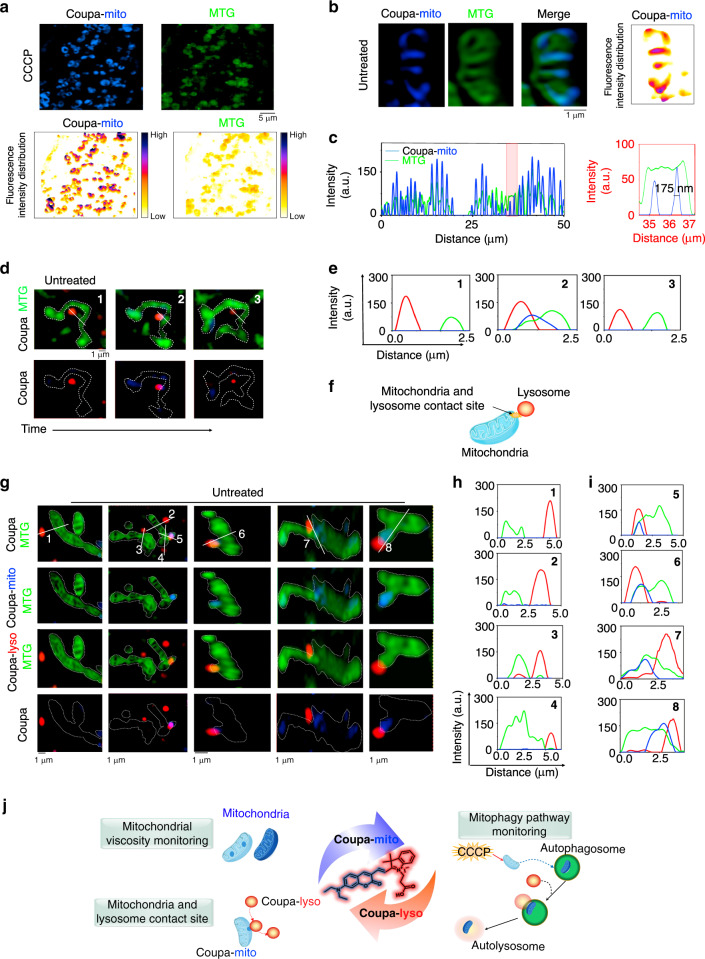
Fig. 4. Coupa reports unevenly distributed viscosity within mitochondria and identifies mitochondria–lysosome contact (MLC) sites via SIM imaging.
a Fluorescence distribution of mitochondria stained with Coupa-mito and MTG in CCCP-treated cells; b the distribution of mitochondria cristae in untreated HeLa cells co-stained with Coupa-mito and MTG. c Distribution of fluorescence intensity on the solid lines across mitochondria (showed in Supplementary Fig. 20) stained with Coupa-mito and MTG, showing a spatial resolution of Coupa-mito-stained mitochondria up to 175 nm. d The dynamic process of mitochondria and lysosome contact in untreated HeLa cells stained by MTG and Coupa-mito; and e the related distribution of fluorescence intensity on solid white lines in d, showing the appearance of blue fluorescence as the lysosome approaches the mitochondria. f Schematic representation of MLC contact site. g MLC events revealed in untreated HeLa cells co-stained with Coupa and MTG. 1–4 show areas with no MLC events and solid white lines correspond to fluorescence intensity shown in h, while 5–8 show representative MLC events and solid white lines correspond to fluorescence intensity shown in i. j Schematic representation of the application of Coupa for synchronously monitoring mitochondria–lysosome interactions. MTG channel: Ex, 488 nm, Em, 500–550 nm; Coupa-lyso channel: Ex, 561 nm, Em, 570–640 nm; and Coupa-mito channel: Ex, 405 nm, Em, 420–495 nm.

