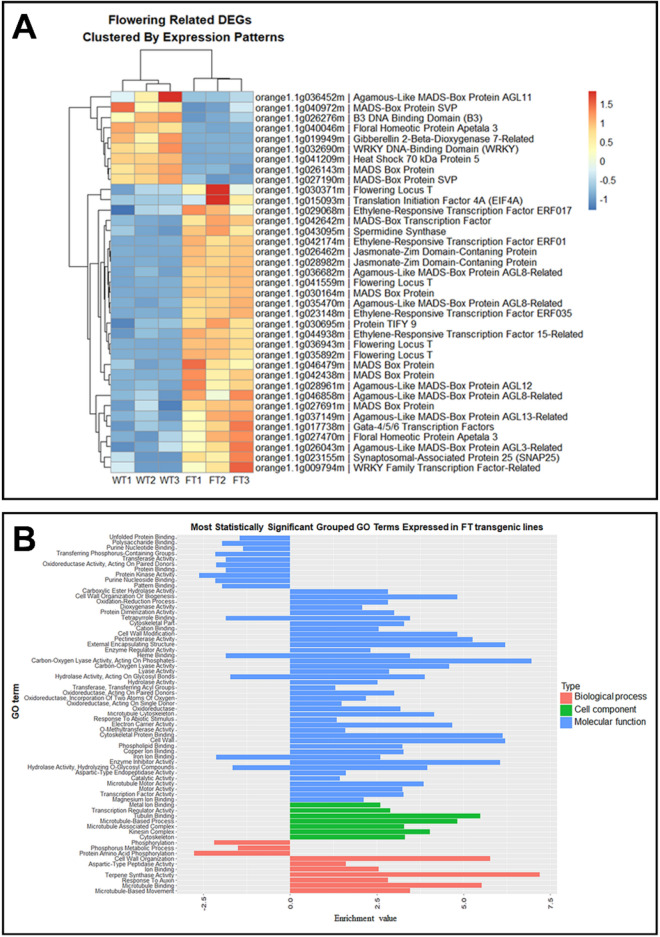
Figure 10.
Heat map of RNAseq transcriptome analysis of 50 selected genes clustered by expression patterns and Gene Ontology (GO) enrichment analysis. (A) Heatmap displaying changes in gene expression between the MP3 transgenic line and non-transgenic plants. The DEGs were classified in flowering genes, APETALA2/ETHYLENE RESPONSE FACTOR (AP2/ERF) family, the jasmonic acid (JA) pathway. A color range of dark to light red represents upregulated genes in the transgenic lines with the most upregulated genes being dark red. A color range of dark to light blue represents the downregulated genes in the transgenic line with dark blue being the most downregulated genes (B) Bar graph showing the enrichment of gene ontology terms in differentially expressed genes in the MP3 transgenic line. In the x-axis the enrichment values are represented and GO terms are represented in the y-axis. The blue bars represent biological processes, green bars represent cellular components, and the red bars represent molecular function.

