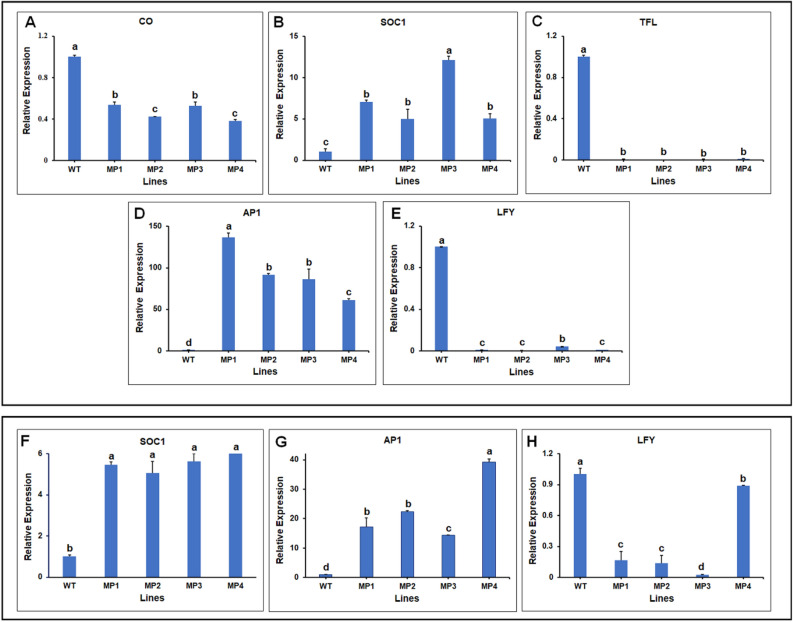
Figure 6.
Evaluation of flowering pathway related genes. (A–E) Relative expression of flowering related genes for each of the 16-month old transgenic lines compared to the non-transgenic Carrizo citrange shown by RT-qPCR (A) CONSTANS (CO), (B) SUPPRESSOR OF OVEREXPRESSION OF CONSTANS 1 (SOC1), (C) TERMINAL FLOWER1 (TFL1), (D) APETALA1 (AP1) and (E) LEAFY (LFY). RNA was extracted from leaf petioles rich in phloem tissues. (F–H) Total RNA was extracted from leaf tissues to show the expression flowering pathway genes by RT-qPCR (A) SOC1, (B) AP1 and (C) LFY in the AtSUC2-CcFT3 transgenic lines compared to the Carrizo citrange non-transgenic line. CsACTIN was used as the reference gene. Data represent the mean (± standard deviation, SD) of three technical replicates. Different letters represent a significant difference at P < 0.05 using Student's t-Test.

