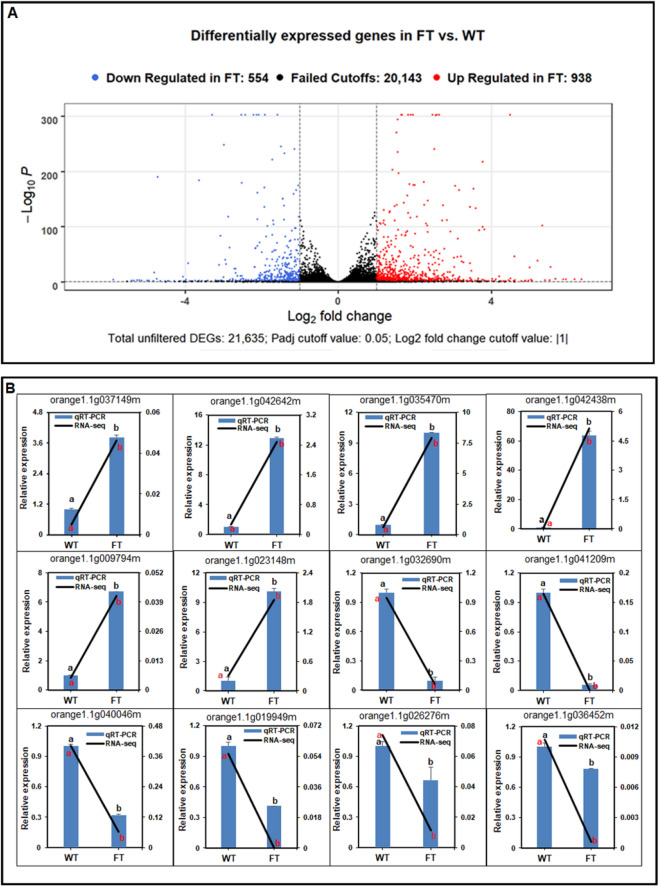
Figure 9.
A volcano plot of DEGs and validation of the transcriptome analysis of selected DEGs using RT-qPCR. (A) Volcano plot showing the Log2 fold change difference and the adjusted P-value for 21,635 genes included on all platforms. The red dots represent upregulated genes and the blue dots the downregulated genes in AtSUC2-CcFT3 MP3 transgenic lines (adjusted P < 0.05). (B) The expression levels of DEG candidates in AtSUC2-CcFT3 MP3 transgenic line was calculated using 2-ΔΔCt and those values were compared to non-transgenic control values. Different letters (a, b) represent a significant difference at P ≤ 0.05 using Duncan’s Multiple Range Test and error bars represent SE (n = 3) for RT-qPCR (black) and RNAseq (blue).

