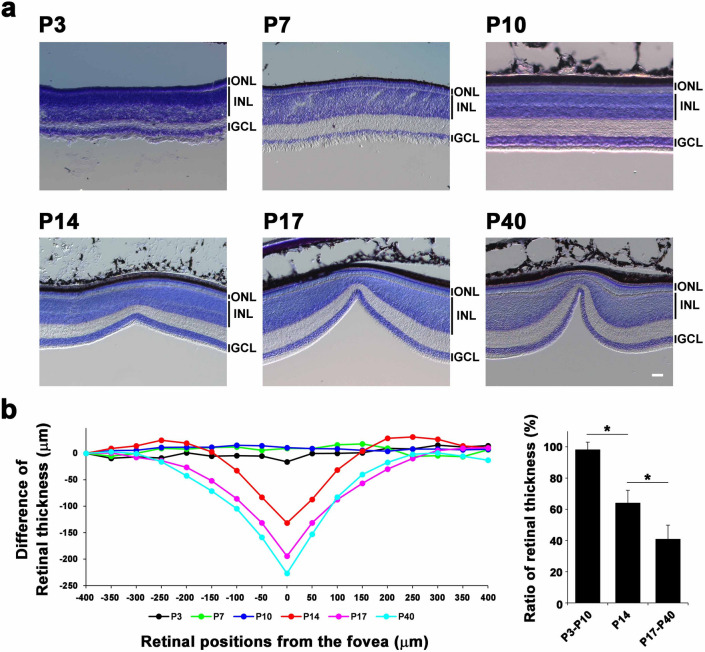
Figure 2.
Foveal development in the zebra finch retina. (a) Toluidine blue staining of zebra finch retinal sections at P3, P7, P10, P14, P17, and P40. A foveal pit was not observed at P3, P7, or P10, but was detected at P14, P17, and P40. The depth of the fovea was deepened continuously from P14 to P40. Scale bar = 50 μm. ONL, outer nuclear layer; INL, inner nuclear layer; GCL, ganglion cell layer. (b) The representative differences in the thickness at each retinal position (at evenly spaced 50 μm intervals from nasal (− 400 μm) to temporal (400 μm) retina; 0 μm indicates the center of the fovea). The thickness from the most nasal position (− 400 μm) of the zebra finch retina at each stage was plotted and traced (left panel). The ratio of retinal thickness at the center of the fovea (0 μm) to the most nasal position (− 400 μm) was plotted for each developmental stage (P3 to P10, P14, and P17 to P40) (right panel). Significant differences assessed using a Student’s t-test are marked by an asterisk. One bird at P3, two birds at P7, one bird at P10, three birds at P14, two birds at P17, and two birds at P40 were used to examine one retina of each bird.

