Figure 4.
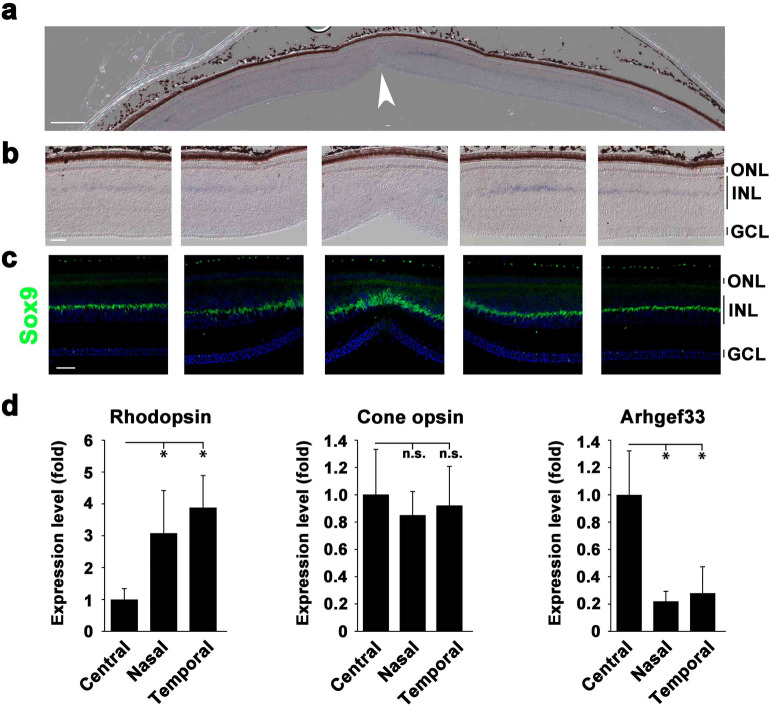
Specific expression of Arhgef33 in the parafovea of the P14 zebra finch retina. (a) In situ hybridization analysis of Arhgef33 expression in the zebra finch retina at P14. The arrowhead indicates a foveal pit. Scale bar = 200 μm. (b) Higher magnification images of the fovea (center) and parafovea (left, left center, right center, right). The Arhgef33 expression was observed in the middle layer of the INL in the parafovea, while the Arhgef33 expression was absent at the center of the fovea. Scale bar = 50 μm. ONL, outer nuclear layer; INL, inner nuclear layer; GCL, ganglion cell layer. (c) Immunostaining of P14 zebra finch retinal sections using an anti-Sox9 antibody (green) and DAPI (blue). Sox9 signal was detected in the middle layer of the INL. Scale bar = 50 μm. (d) Expression levels of Rhodopsin (left panel), Cone opsin (middle panel), and Arhgef33 (right panel) were measured by RT-qPCR using RNAs purified from the foveal, nasal, and temporal regions of P14 zebra finch retinas. Rhodopsin expression was up-regulated in the nasal and temporal regions, while Cone opsin expression levels were not significantly different between each region. Arhgef33 expression was up-regulated in the foveal region. Significant differences assessed using a Mann–Whitney U test are marked by an asterisk (n = 5; one retina of each bird). n.s., not significant.

