Figure 5.
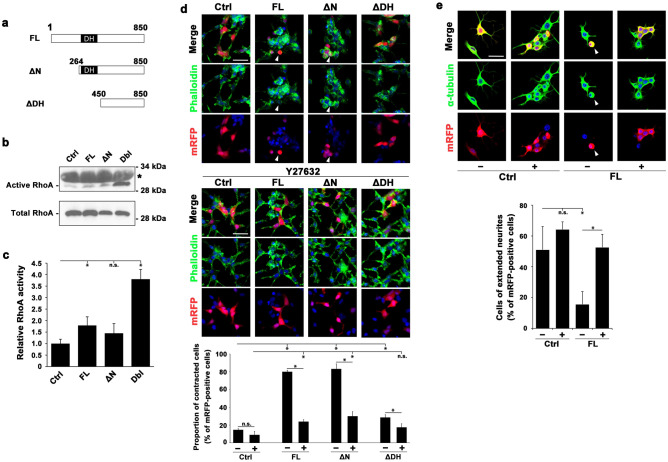
Arhgef33 exhibits a RhoA GEF activity. (a) Domain structures of Arhgef33. Full-length (FL, residues 1–850), N-terminal truncated (ΔN, residues 264–850) and DH-domain truncated (ΔDH, residues 450–850) Arhgef33 are illustrated. (b,c) The representative image of western blot analysis. (b) Bands of active (upper panel) and total (lower panel) HA-tagged RhoA in cell lysates from HEK293 cells transfected with plasmids coding genes depicted in each column were determined by immunoblotting with anti-HA antibody. Asterisk indicates non-specific bands. (c) Relative RhoA activities are indicated by the amount of active RhoA normalized to total RhoA. Significant differences assessed using a Student’s t-test are marked by an asterisk (three independent experiments). n.s., not significant. The full image of the western blots was shown in Fig. S1. (d) Immunofluorescence image of HEK293 cells co-transfected with plasmids encoding mRFP and each one of genes depicted in a column with/without treatment of Y27632 (upper and middle panels). The percentage of contracted cells relative to the total number of mRFP-positive cells (total cell number = 100 to 150) is shown (lower panel). Significant differences were assessed using a Student’s t-test are marked with an asterisk (three independent experiments). n.s., not significant. Scale bar = 50 μm. (e) Immunofluorescence image of RA-treated N2A cells co-transfected with plasmids encoding mRFP and an Arhgef33 or control plasmid with/without Y27632 (upper panel). The percentages of the number of cells with extended neurites against total number of mRFP-positive cells (total cell number = 30) were calculated (lower panel). Significant differences were assessed using a Student’s t-test are marked with an asterisk (three independent experiments). n.s., not significant. Scale bar = 50 μm.

