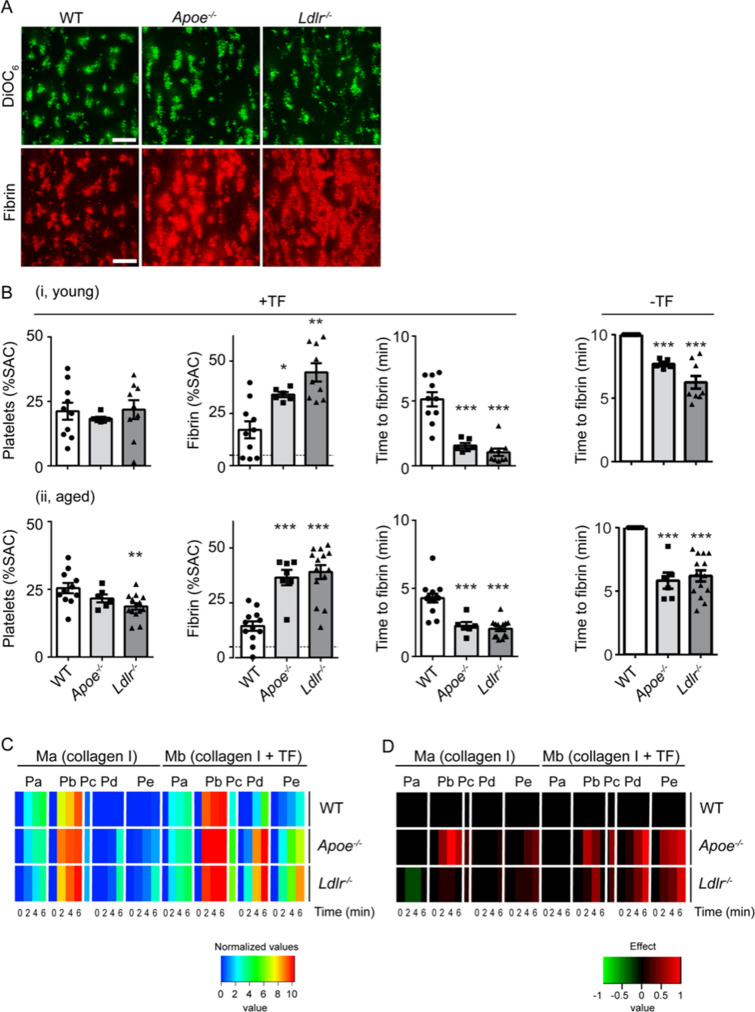
Figure 2.
Deficiency in ApoE or LDLR enhances formation of platelet–fibrin thrombi in the presence of coagulation at arterial flow rate. Blood was obtained from young (9–12 weeks) and aged (37–42 weeks) Apoe−/−, Ldlr−/− and corresponding wild-type mice held on normal chow diet. Citrated blood samples were supplemented with DiOC6 (labeling platelets) plus AF647 fibrinogen, and co-perfused with CaCl2/MgCl2 over two microspots consisting of collagen (microspot Ma) and collagen/TF (microspot Mb) at a wall shear rate of 1000 s−1. Confocal two-color fluorescence images were captured in real time at 45 s time intervals. (A) Representative images of deposited platelets (DiOC6, green) and fibrin (AF647, red) from young mice at spot Mb after 4 min; bars = 20 µm. (B) Quantification of surface area coverage (% SAC) of platelet deposition, and fibrin-covered area at spot Mb after 4 min; horizontal dotted line indicates labeling threshold for fibrin formation, as well as quantification of time to first fibrin formation of (i) young mice and (ii) aged mice. Left part: whole blood was perfused over collagen co-coated with tissue factor (+ TF), right part: Time to first fibrin formation in whole blood perfused over collagen without tissue factor (− TF). (C) Thrombus parameters were obtained from brightfield and fluorescence images at time points 0, 2, 4 and 6 min: Pa, DiOC6 platelet deposition (% SAC); Pb, DiOC6 platelet thrombus score (0–5); Pc, time to first fibrin formation (− log min); Pd, AF647 fibrin score; Pe, AF647 fibrin-covered area (% SAC). Values per parameter were linearly scaled to 0–10. Presented is a scaled heatmap of the integrated age groups (9–12 weeks and 37–42 weeks, see suppl. Figure 3). (D) Scaled heatmap of changes per genotype, filtered for moderate effect size. Effect size per parameter was calculated from pooled standard deviation, Cohen’s d and regression coefficient r. Analysis based on relevant changes restricted to differences with P < 0.05 (t test, 2-sided, equal variance). Means (n = 13–23 animals/group).

