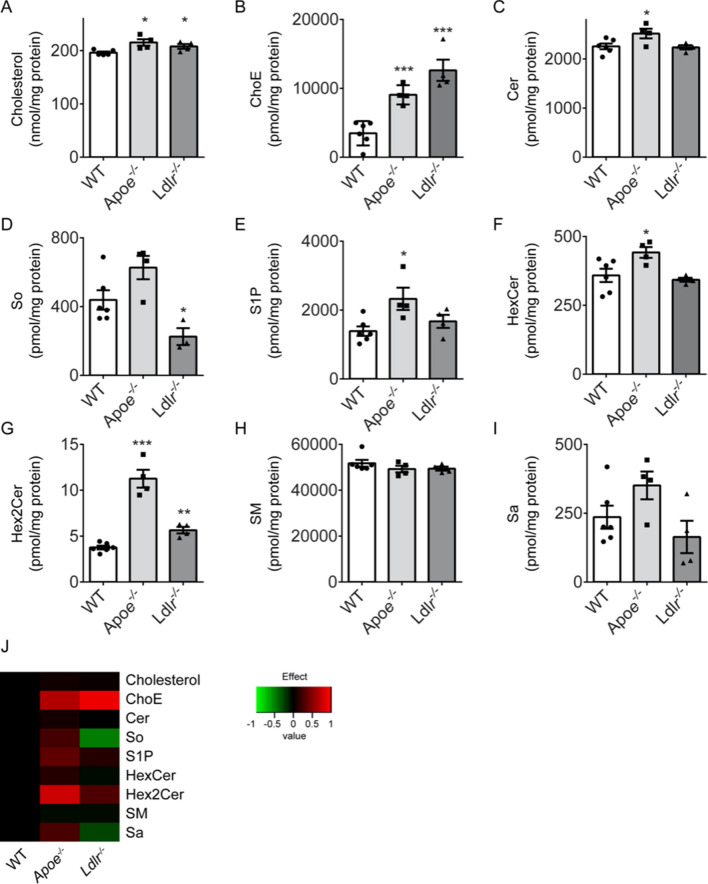
Figure 7.
Alterations in lipid profile in platelets from Apoe−/− and Ldlr−/− mice. Highly purified platelets from wild-type, Apoe−/− and Ldlr−/− mice were used for quantitative lipidomic analysis. (A) Cholesterol and (B) cholesteryl esters (ChoE); (C) ceramides (Cer); (D) sphingosine (So); E) sphingosine-1-phosphate (S1P); F) glycosylceramide or galactosylceramide (HexCer); (G) lactosylceramide (Hex2Cer); (H) Sphingomyelin (SM); (I) sphinganine (Sa). Means ± SEM (n = 4–6 animals/group), *P < 0.05, **P < 0.01, ***P < 0.001 (Mann–Whitney U test). (J) Cluster analysis of quantitative lipidome analysis. Significantly altered lipid classes of Apoe−/− or Ldlr−/− platelets compared to wild-type platelets (log2 transformed) are indicated in red (increased) or in green (decreased).

