Fig. 1.

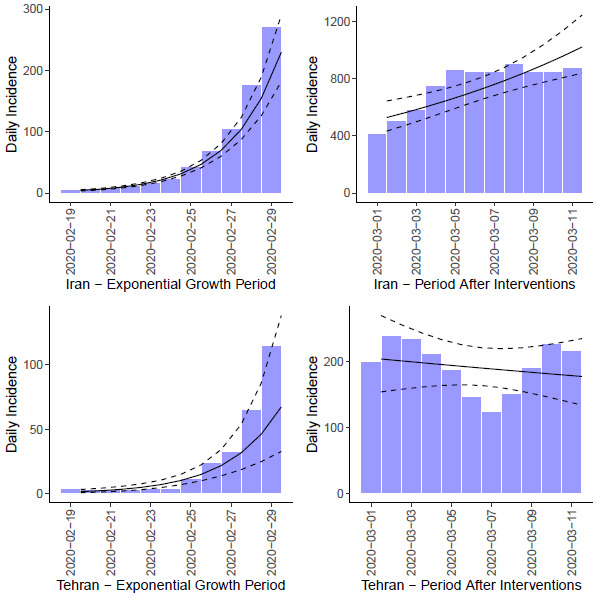
The epidemic curve of the COVID-19 in Iran (top) and Tehran (bottom) before the beginning of interventions (right) and after the beginning of interventions (left) according to the moving average smoothed data of confirmed cases.

The epidemic curve of the COVID-19 in Iran (top) and Tehran (bottom) before the beginning of interventions (right) and after the beginning of interventions (left) according to the moving average smoothed data of confirmed cases.