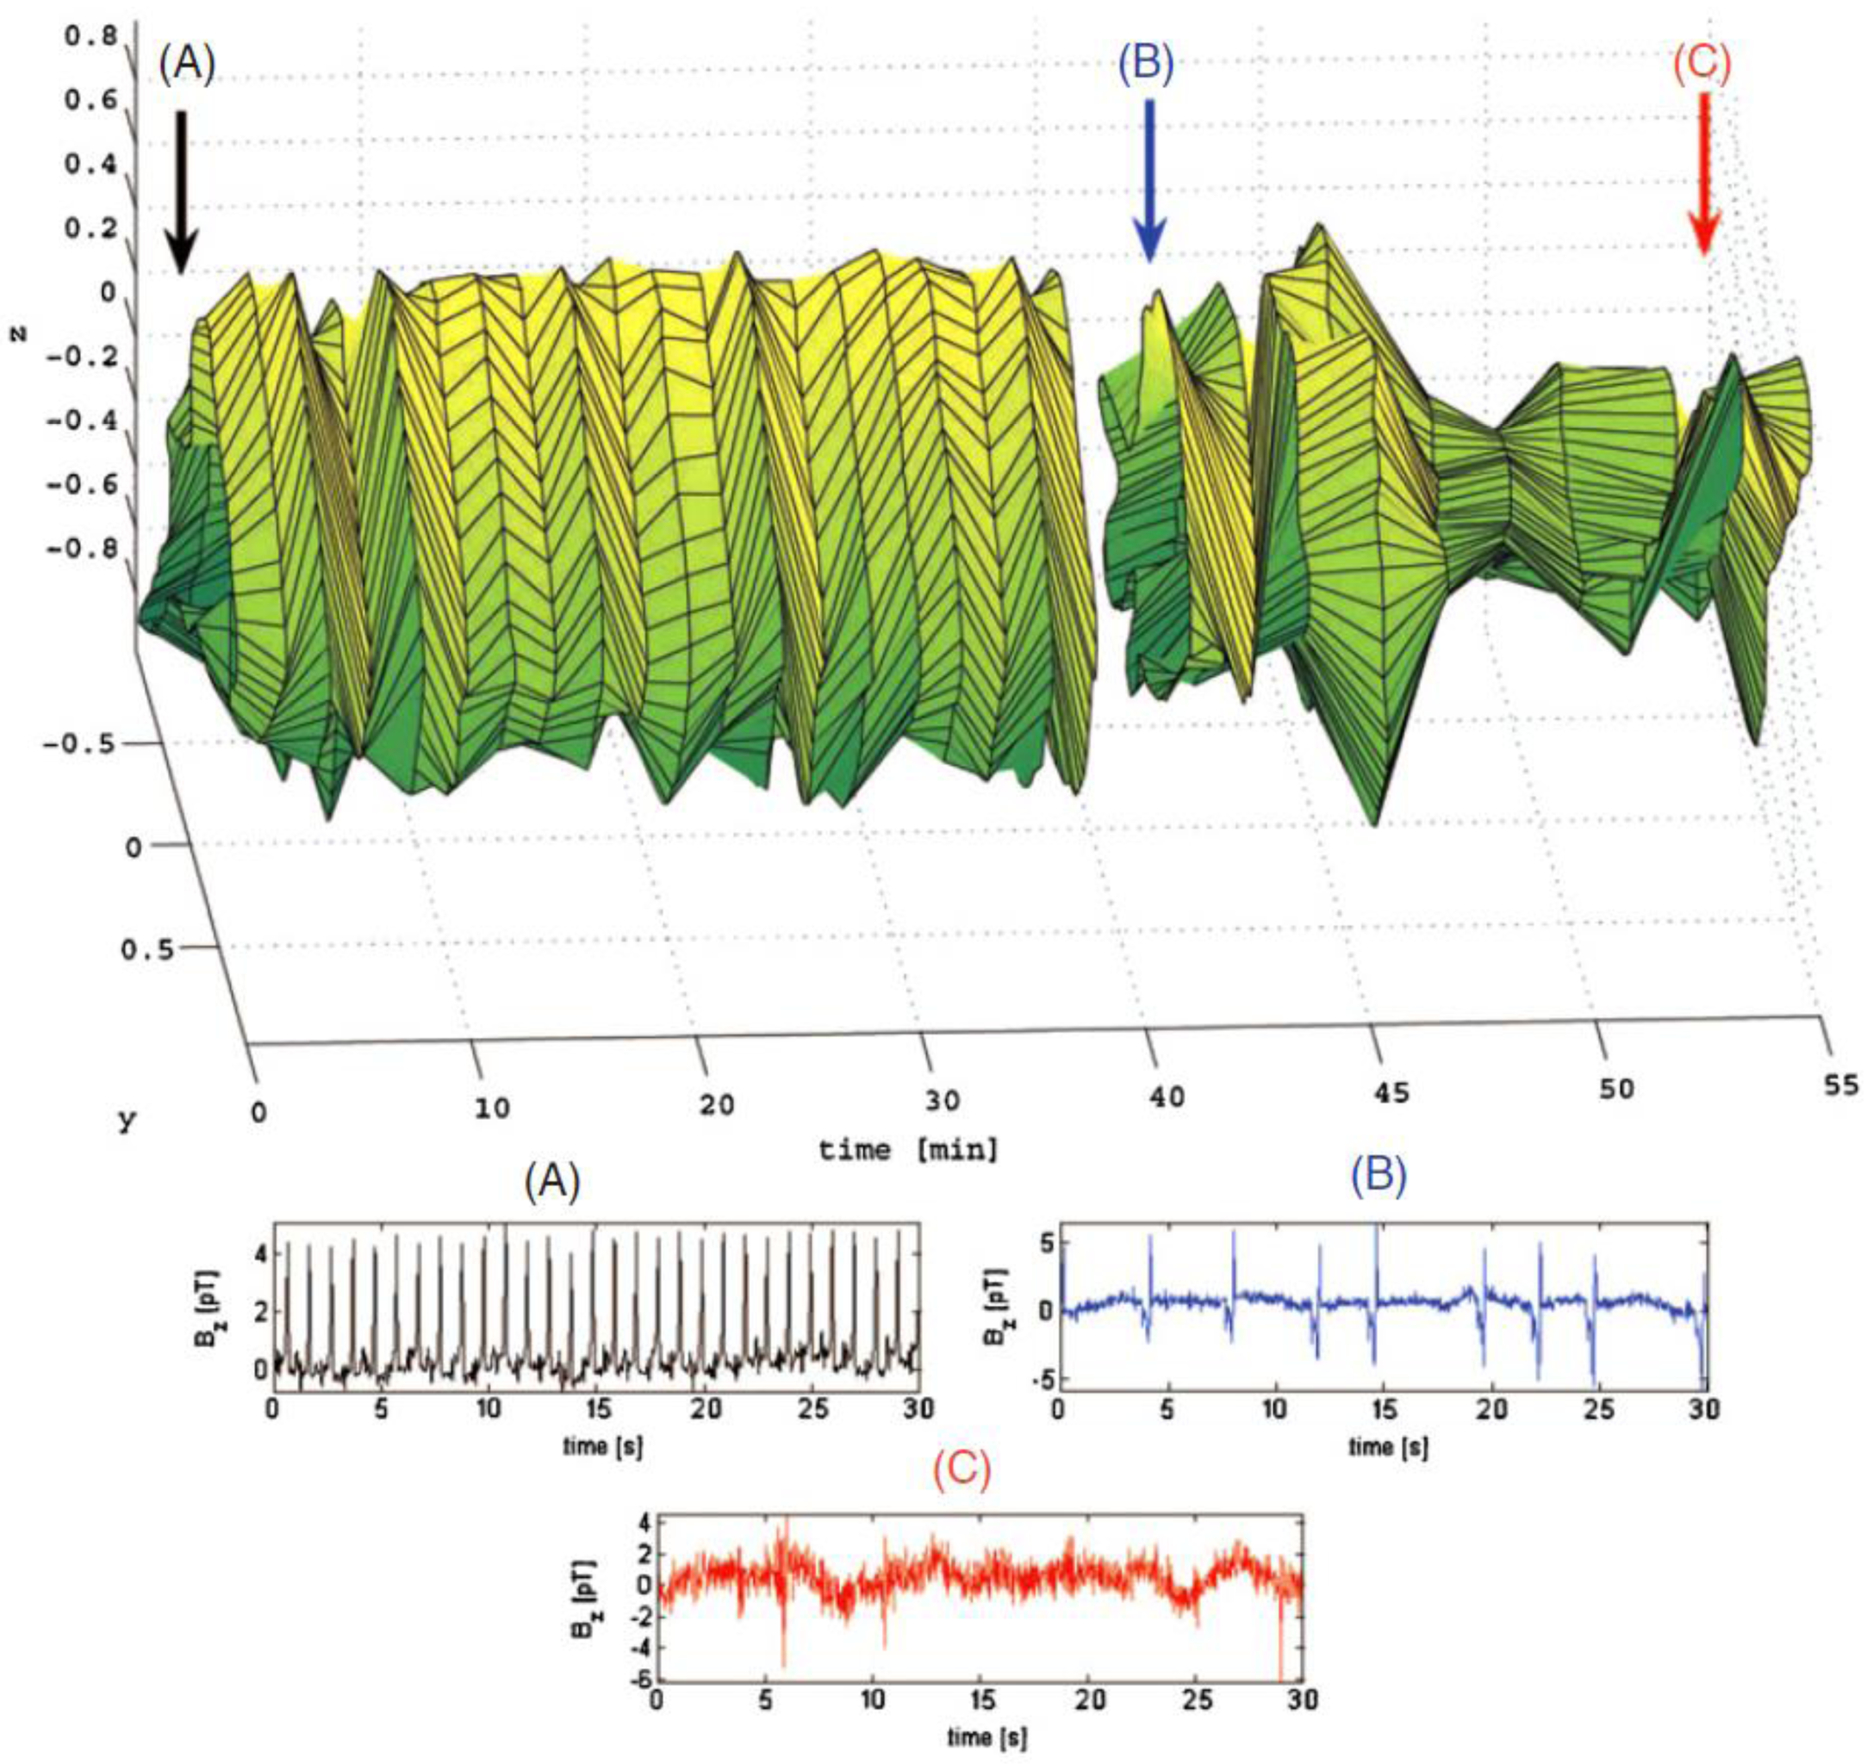
Figure 1.

3D (x, y, t) STRM of cardiac activity evolution in an anesthetized domestic pig across a period of one hour of simultaneous MCG/MGG/MENG recordings. The point indicated by arrow (A) corresponds to the data plotted in (A), where cardiac activity is normal. Point (B) corresponds to several minutes after the administration of the euthanasic solution (data plot shown in (B)). At this point, a sharp variation in the chaos content of the system can be seen both from the STRM and from (B) due to cardiac arrhythmia. The amount of chaos varies highly over the ensuing 15 min. At (C), cardiac activity has ceased.
