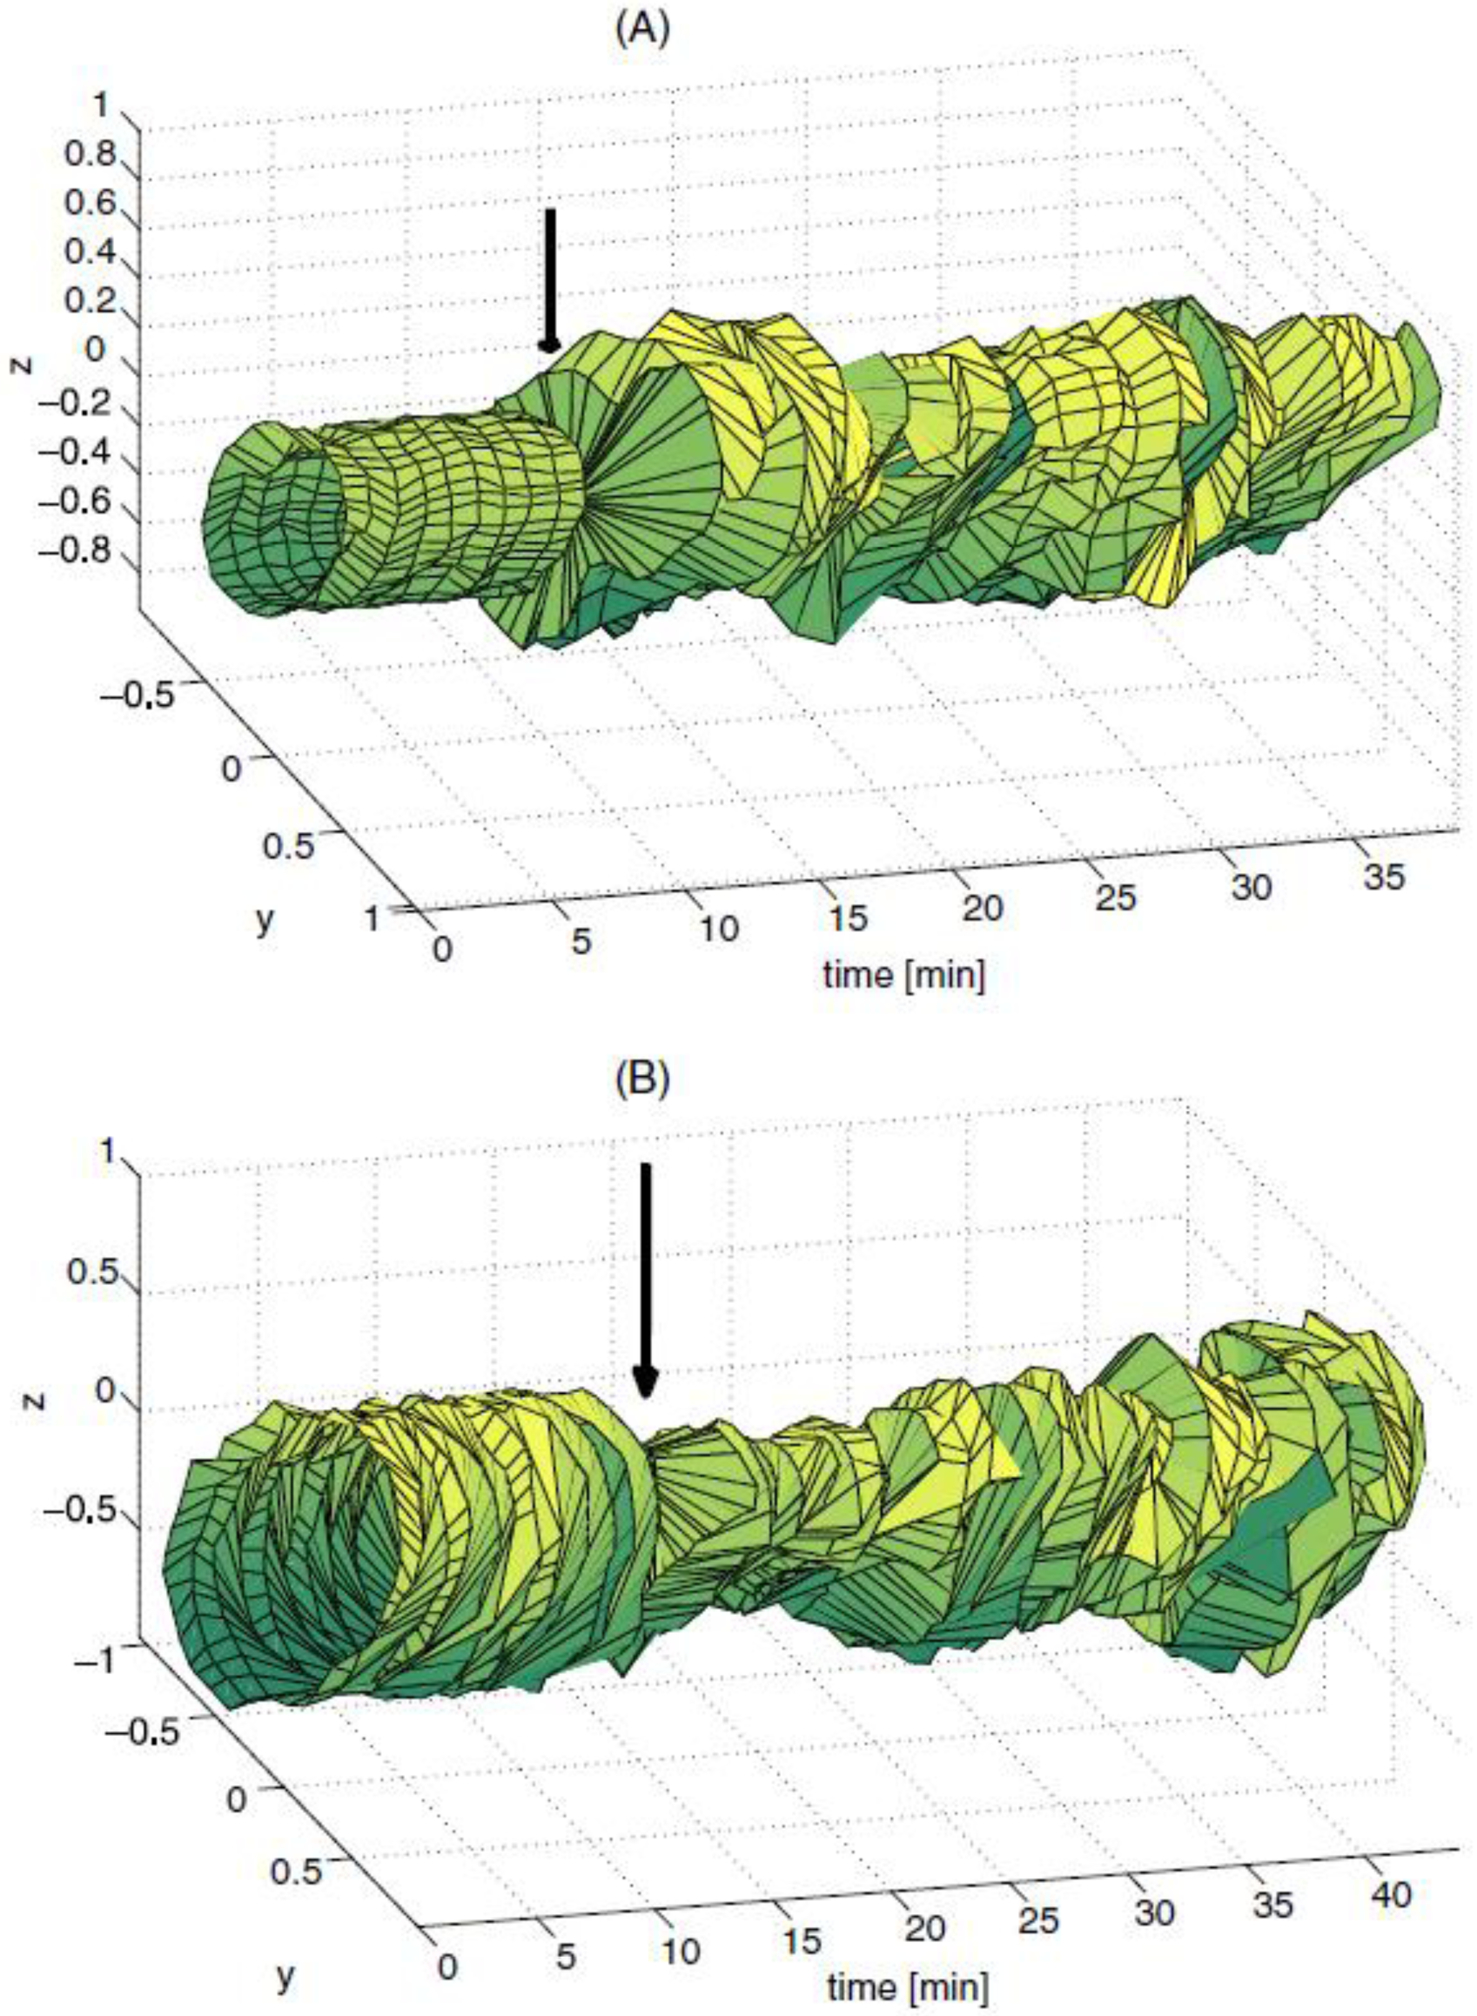
Figure 2.

STRMs displaying the time evolution of gastric (A) and intestinal (B) electrical activities in two anesthetized domestic pigs. In the first pig (plot A), MGG normal data were first recorded. The stomach of the animal was then surgically divided and data were acquired again. The normal (baseline) STRM is displayed to the left of the vertical arrow, while the abnormal STRM is shown to the right of the arrow. In the second pig (B), MENG normal data were recorded from the bowel. Thereafter, intestinal ischemia was induced by ligating the mesenteric artery of the animal and data were acquired again. As in (A), the vertical arrow indicates the separation point in time between normal (left) and abnormal (right) STRMs. Whereas the STRM perimeter is relatively time-constant in the healthy state, it exhibits statistically significant variations in the injured state (B, D, p < 0.05).
