
Figure 3.
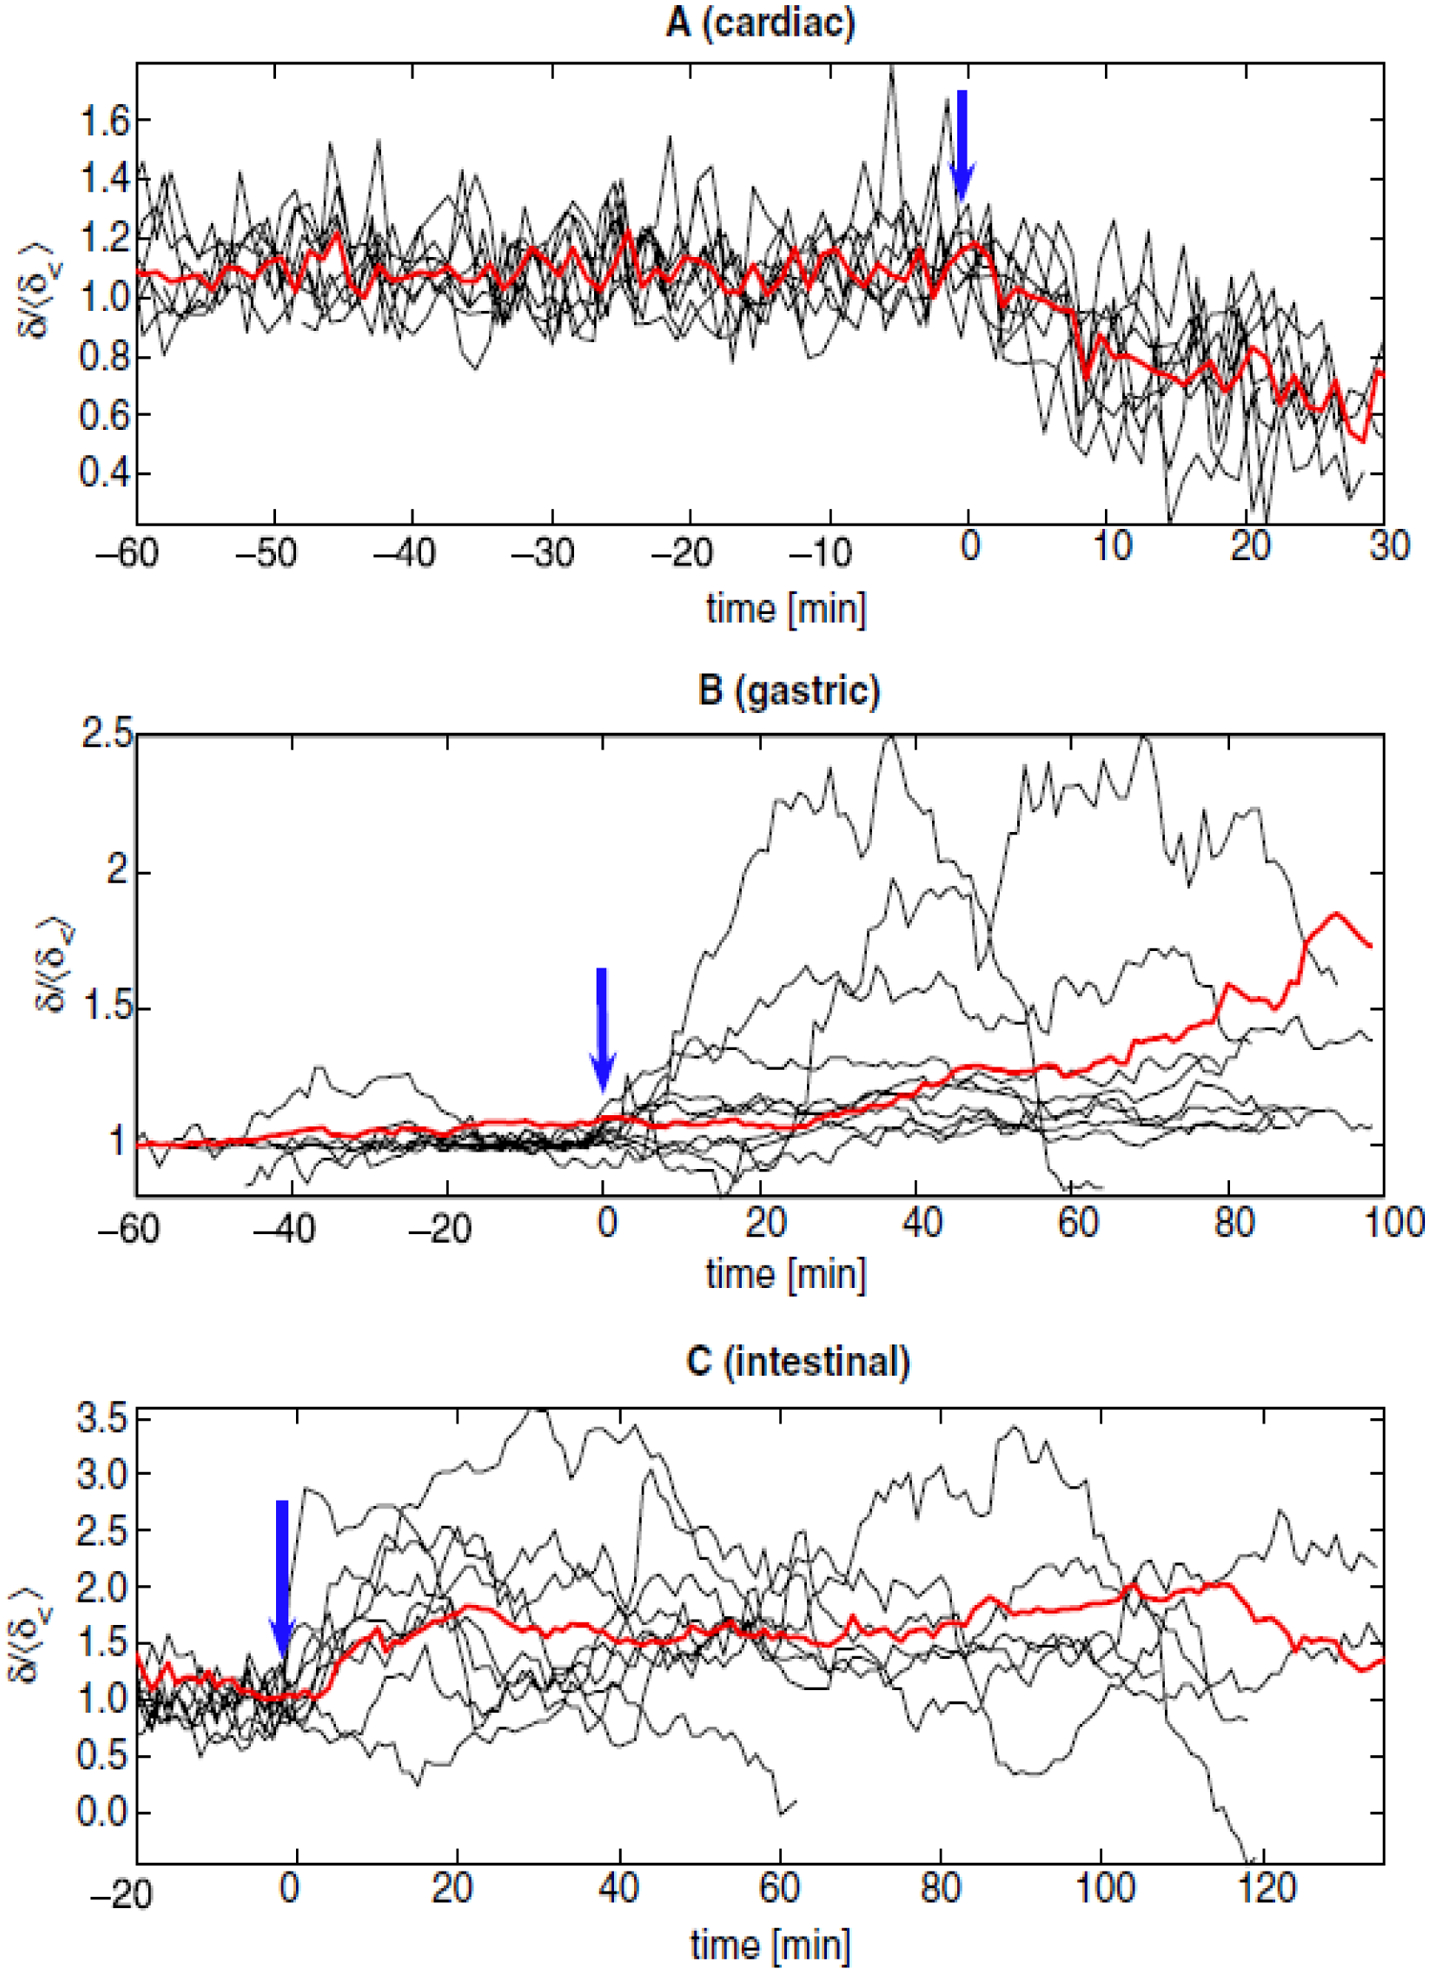
Temporal evolution of the normalized information dimension for all subjects (black) and 〈δ〉 (red). Changes from normal (t < 0 min) to pathological (t > 0 min) values of are indicated by blue arrows. These events are euthanasic injection (A), stomach division (B) and mesenteric artery ligation (C). Because experimental recording periods were not equal for each animal, plots are aligned so that the onset of pathology corresponded to the time t = 0 min. Nevertheless, recordings from the three organs were acquired simultaneously from each animal. Heart rate and values were found to be highly correlated (r = 0.917).