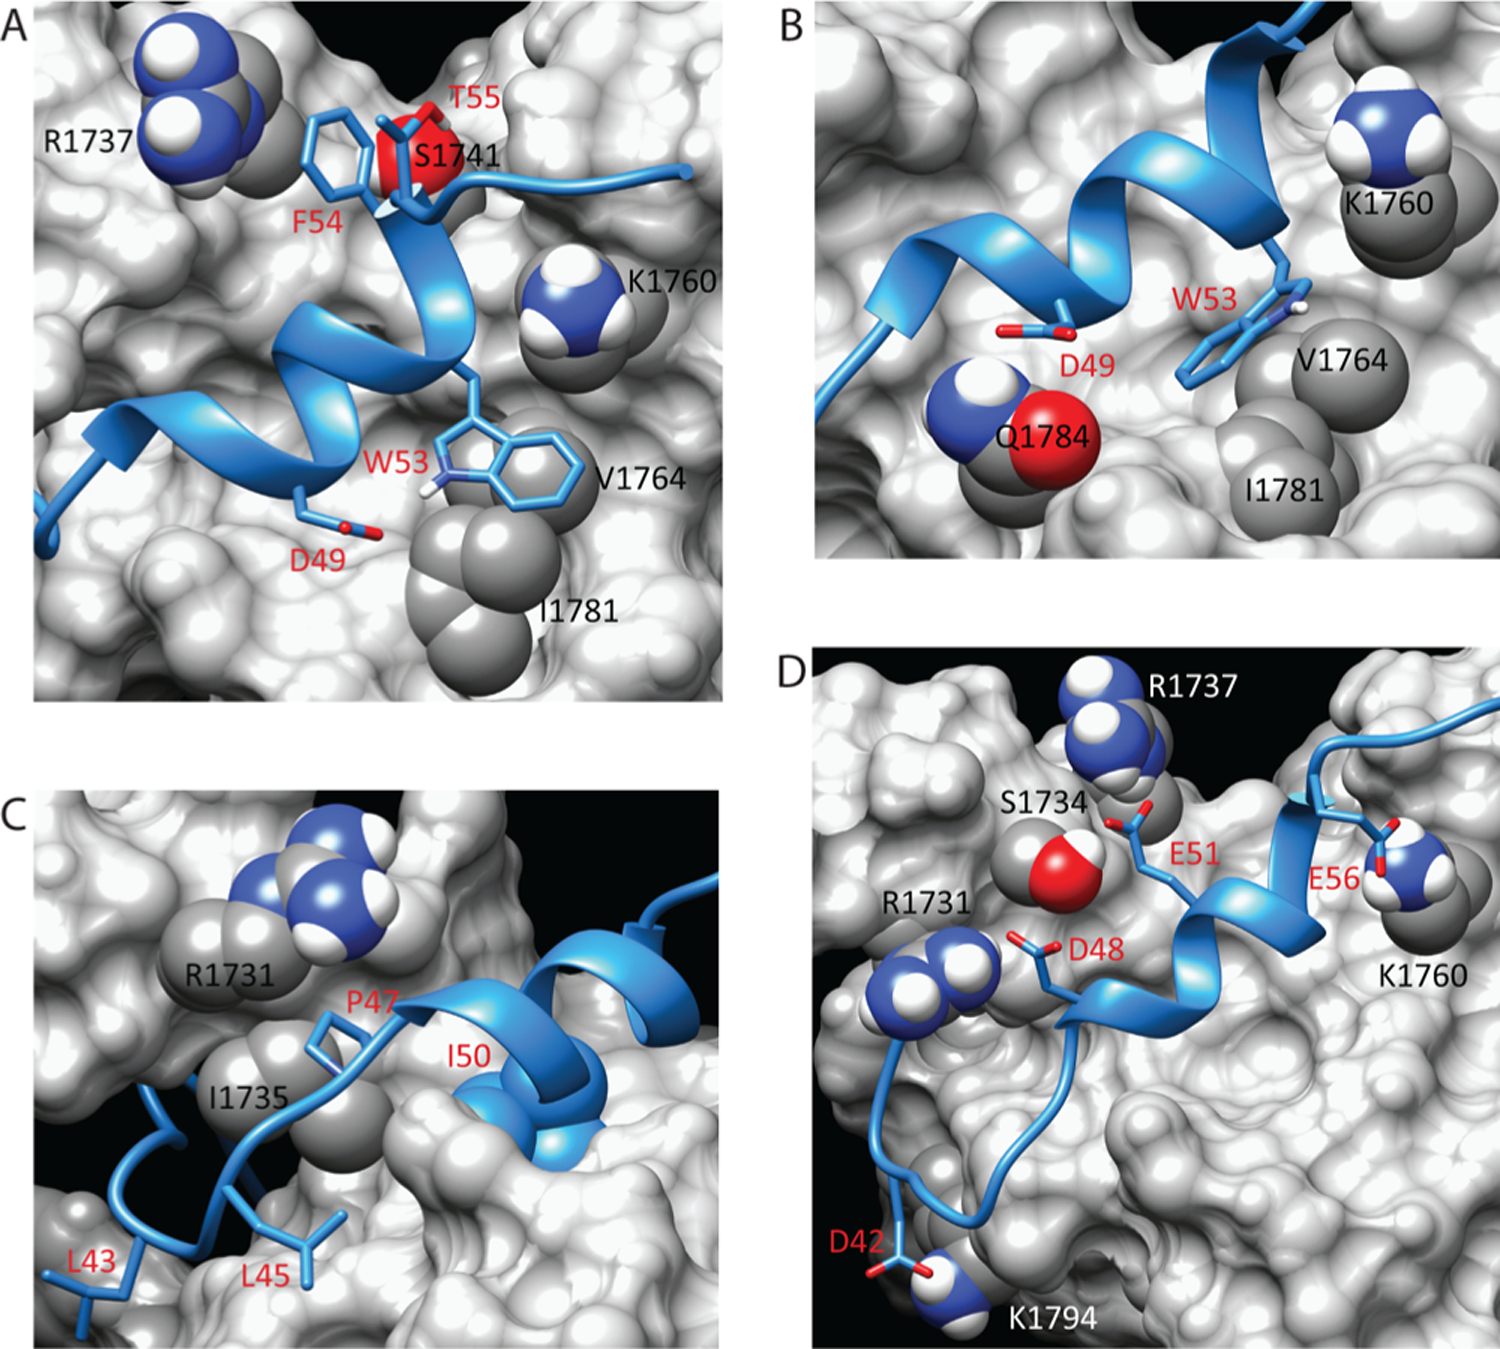
Figure 2.

Stabilizing interactions at the interface of the p53(35–59)–Taz2 complex. (A) Model of the Taz2–p53(35–59) interface showing interactions of p53 Trp53 and Phe54. (B) Model of the Taz2–p53(35–59) complex showing the alternate conformation of Trp53 observed in some members of the ensemble. (C) Model of the Taz2–p53(35–59) interface showing positions of other hydrophobic p53 residues. (D) Model of the Taz2–p53(35–59) complex showing primary residues that make salt bridges and hydrogen bonds. In all panels, contacting residues are labeled in black or white for Taz2 (gray surface representation) and red for p53(35–59) (blue ribbon).
