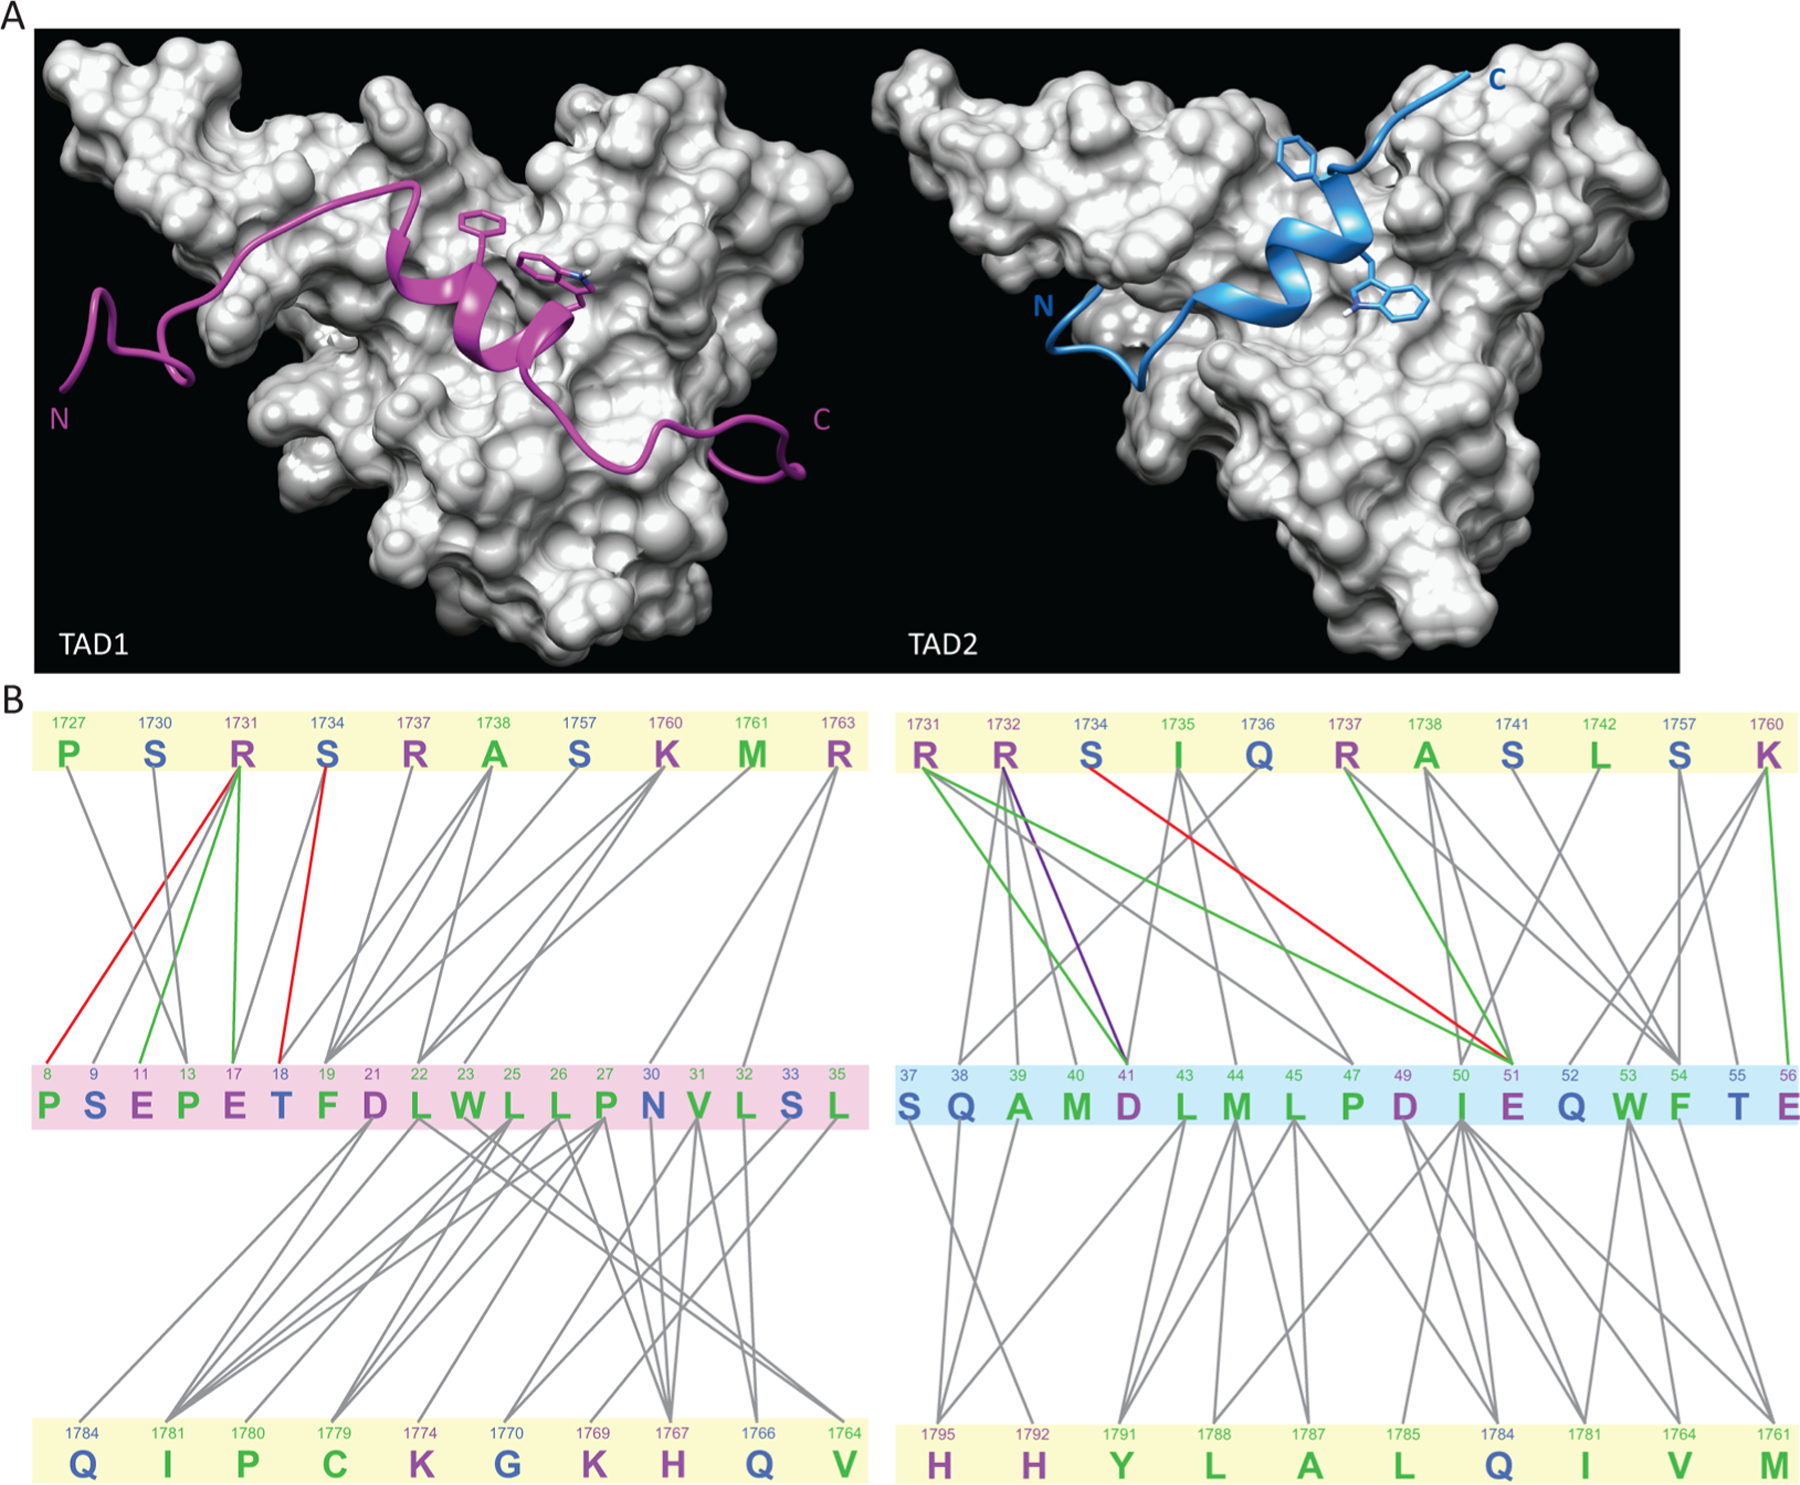
Figure 4.

Comparison of the complexes of Taz2 with the p53 TAD1 and TAD2 domains. (A) Comparison of the structures of the Taz2 complexes with p53 TAD1 (left) and TAD2 (right). While both p53 peptides are shown in backbone ribbon format, with TAD1 colored purple and TAD2 cyan, the highly conserved side chains of F19 and W23 of TAD1 and W53 and F54 of TAD2 are also represented. The Taz2 components, shown as a gray surface representation, have the same orientations in both panels. The p53 TAD1–Taz2 structure is from Protein Data Bank entry 2K8F. (B) Schematic comparison of the intermolecular interactions in the p53 TAD1–Taz2 (left) and p53 TAD2–Tax2 (right) complexes. Interactions indicated were detected in >60% of all members of the ensemble. Figures were generated with MONSTER.38 Taz2 residues are highlighted with a pale yellow background in both panels, and the p53 TAD1 residues are highlighted with a pale mauve background; the p53 TAD2 residues are highlighted with a pale blue background. The lines connect interacting residues, with the following color scheme: green, electrostatic; red, hydrogen bonding; purple, salt bridge; gray, hydrophobic. The text colors indicate the type of residue: green, hydrophobic; blue, polar; magenta, charged.
