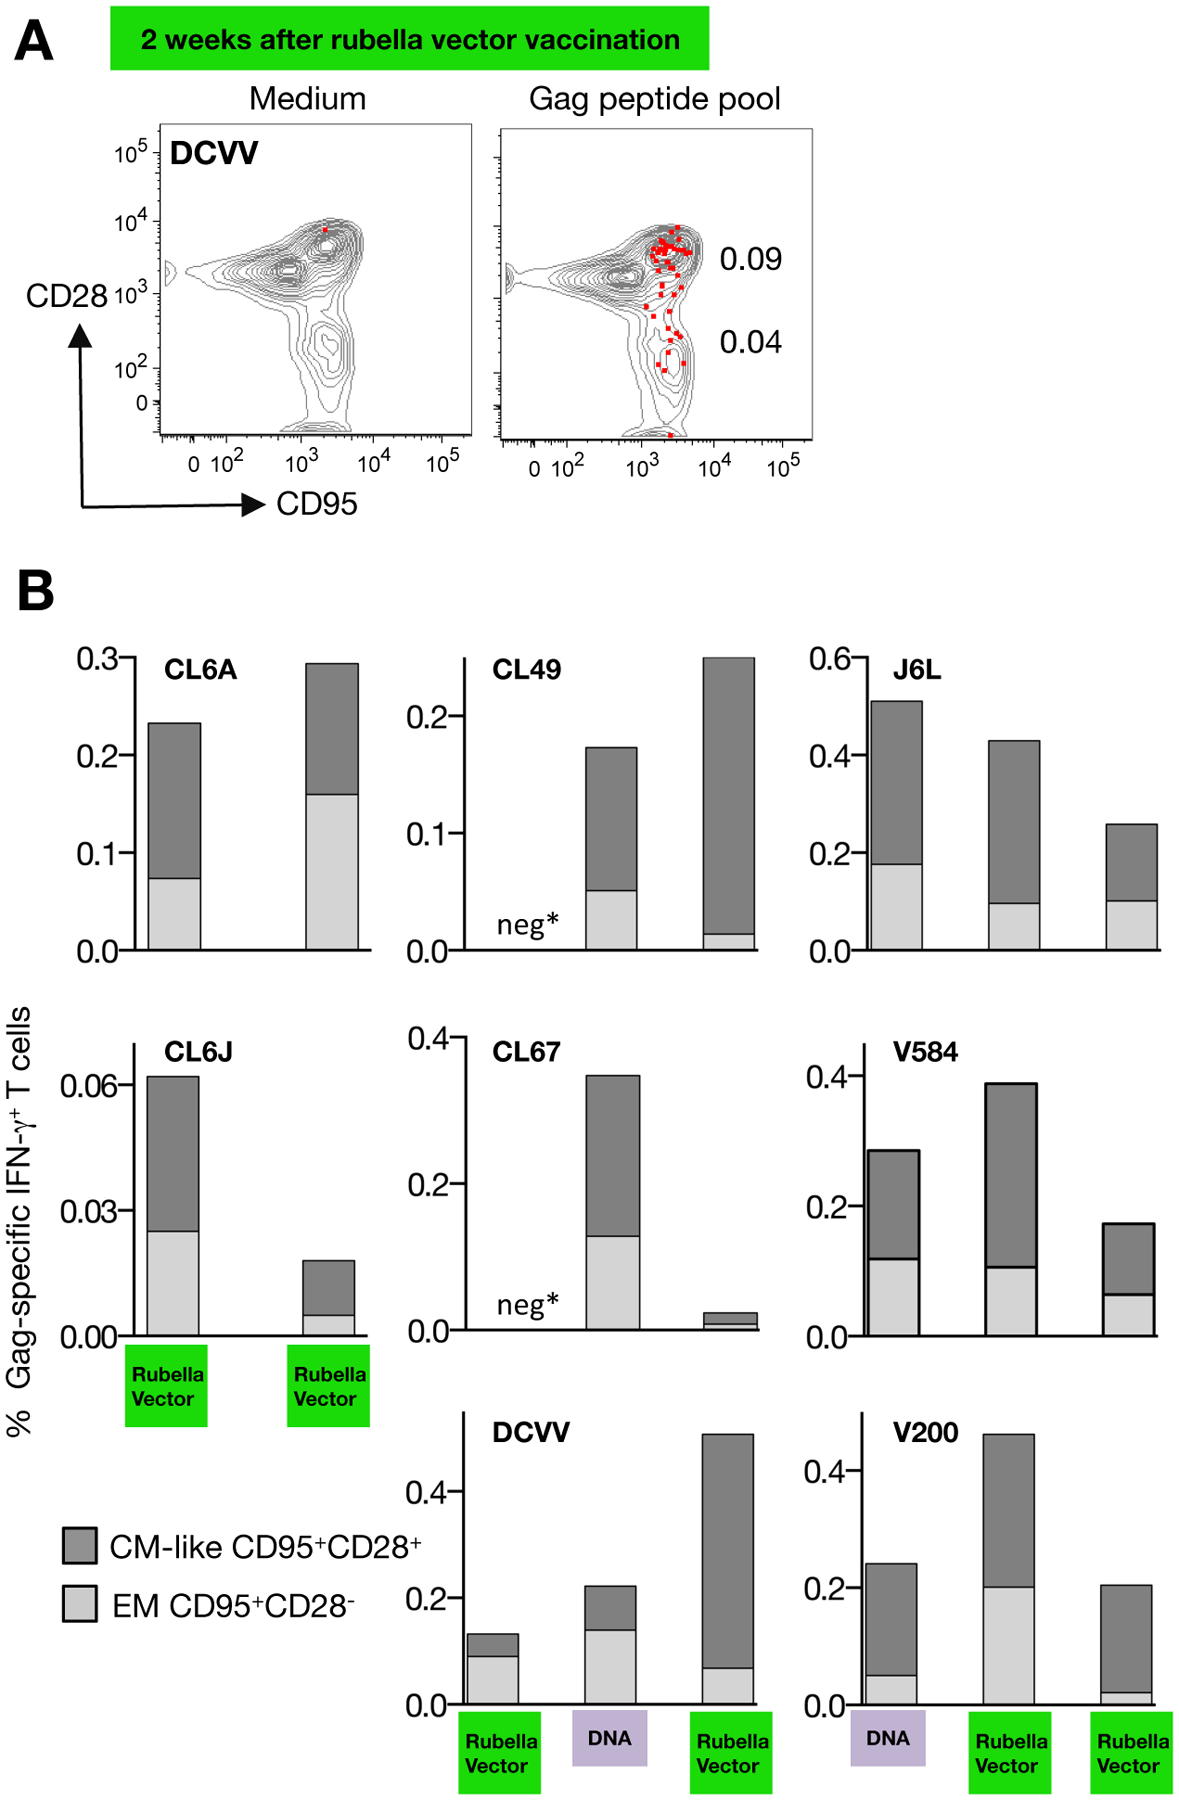
FIGURE 4. Phenotypic analysis of Gag-specific memory T cells.

Gag-specific responses were analyzed by flow cytometry using an antibody cocktail for memory markers. (A) Dot plot overlays show the phenotypic characterization (CM-like: CD95+CD28+; effector memory EM: CD95+CD28−) of the Gag-specific T cells induced by rubella vector type 3 vaccination in macaque DCVV at the day of vaccination and 2 weeks later. (B) The percentage of Gag-specific IFN-γ+ T cells with CM-like and EM cells are shown 2 weeks after the indicated vaccinations. Responses in macaque CL6V could not be analyzed (see Fig. 3). Neg* indicates absence of detectable Gag-specific T cell responses.
