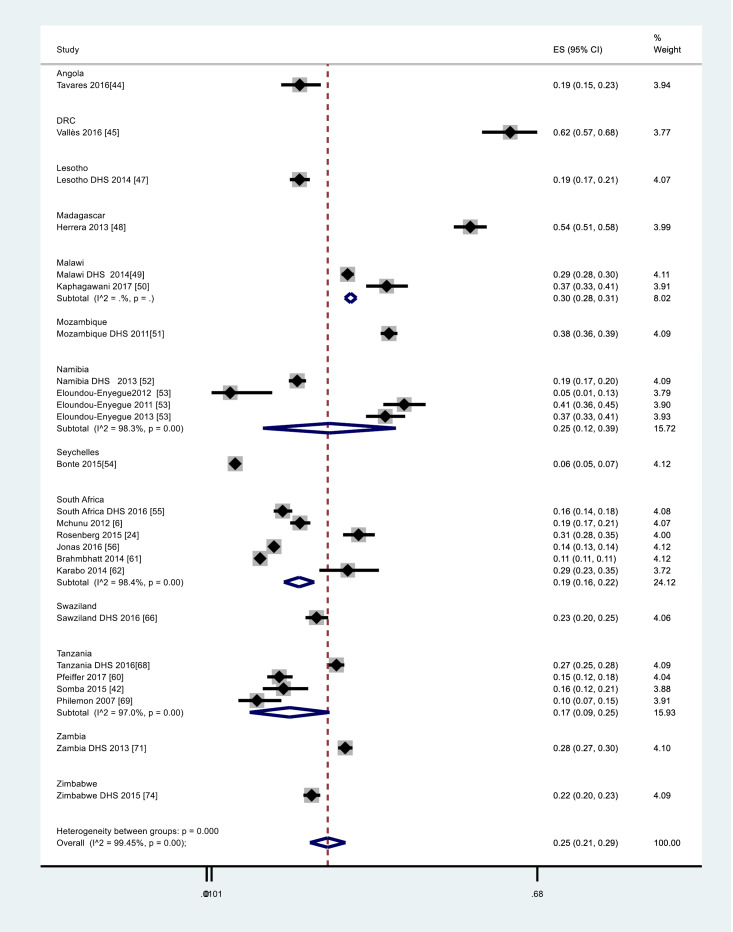
Figure 2.
Forest plot for meta-analysis for rate of pregnancy among adolescent girls and young women (AGYW) aged 10-24 years from 2007-2017. Where the Y-axis described the weighted rate of pregnancy and the x-axis the log scale (0.0101 to 0.68). The proportion and the 95% CI of each study are indicated by the square and horizontal bar. The diamond estimated the pooled pregnancy proportion

