
Fig. 1.
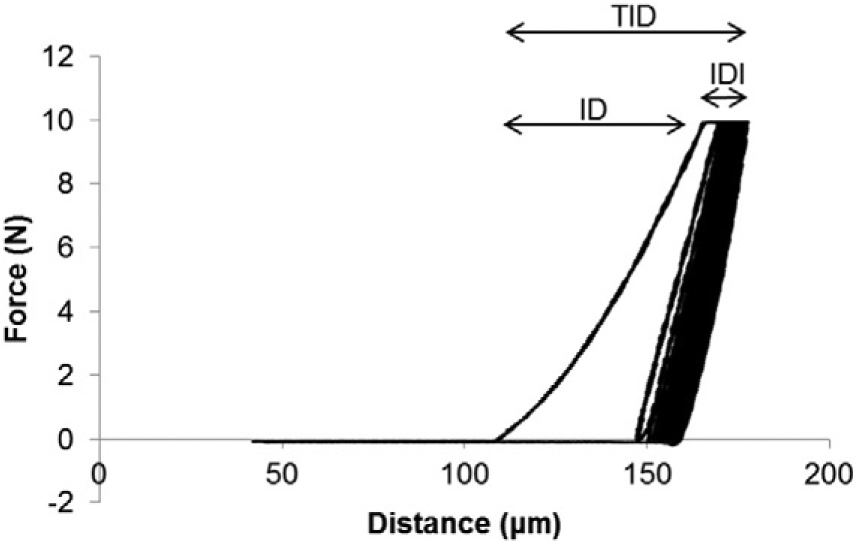
Force versus distance graph for a cyclic-based RPI test with 20 loading cycles. Variables derived from these curves include indentation distance (ID), total indentation distance (TID), indentation distance increase (IDI), loading and unloading slopes, and energy dissipation (ED). Average ED is calculated as the area within the test's hysteresis loop from the third to last cycle. The average slopes during loading and unloading are measured from the third to last cycle.