FIGURE 3.

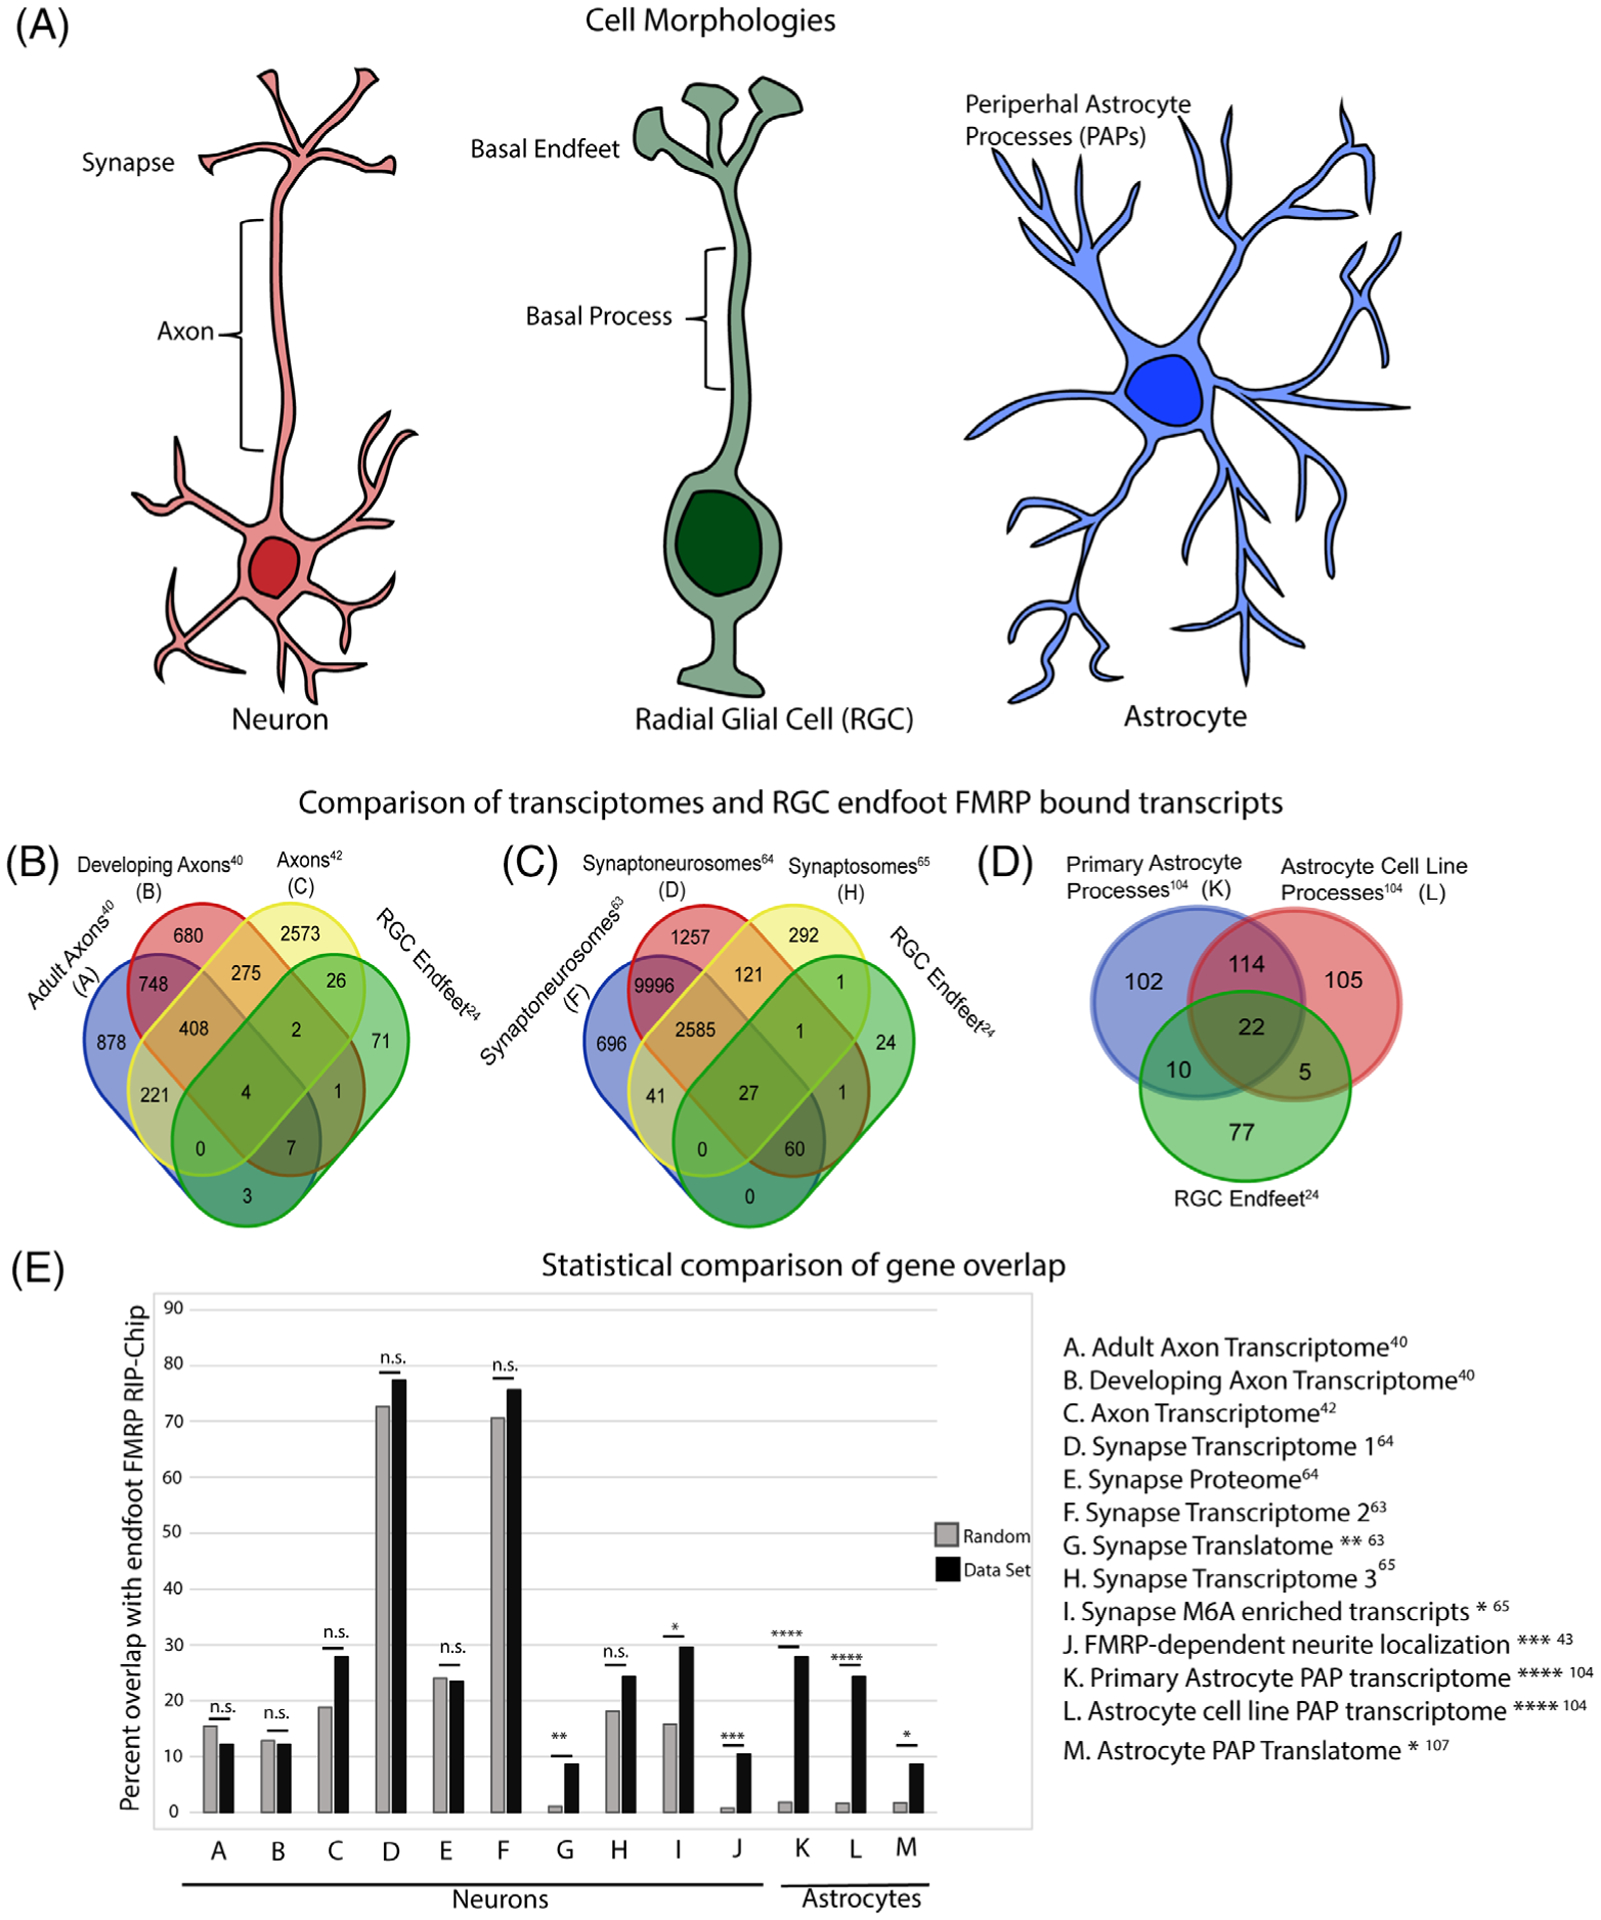
Comparison of radial glial cell (RGC) endfeet, neuronal axons, neuronal synapses and peripheral astrocyte processes. (A) Cartoon representations of neurons, RGCs and astrocytes to depict their unique morphology and emphasize subcellular compartments distant from the cell body. (B-D) Venn diagrams show the comparison of endfoot localized transcripts to mRNAs localized in neuronal axons (B), neuronal synapses (C) and peripheral astrocyte processes (D). (E) Graphical representation of the percent of genes shared between the FMRP RIP-Chip in endfeet and relevant localization datasets compared to a random gene list. Random gene lists were generated through Bootstrap sampling of all the genes present in the FMRP RIP-Chip input. For each comparison, 100 random lists were generated and the mean overlap is represented. P-values were calculated using a two-tailed Fisher’s exact test. *<.05, **<.01, ***<.001, ****<.0001
