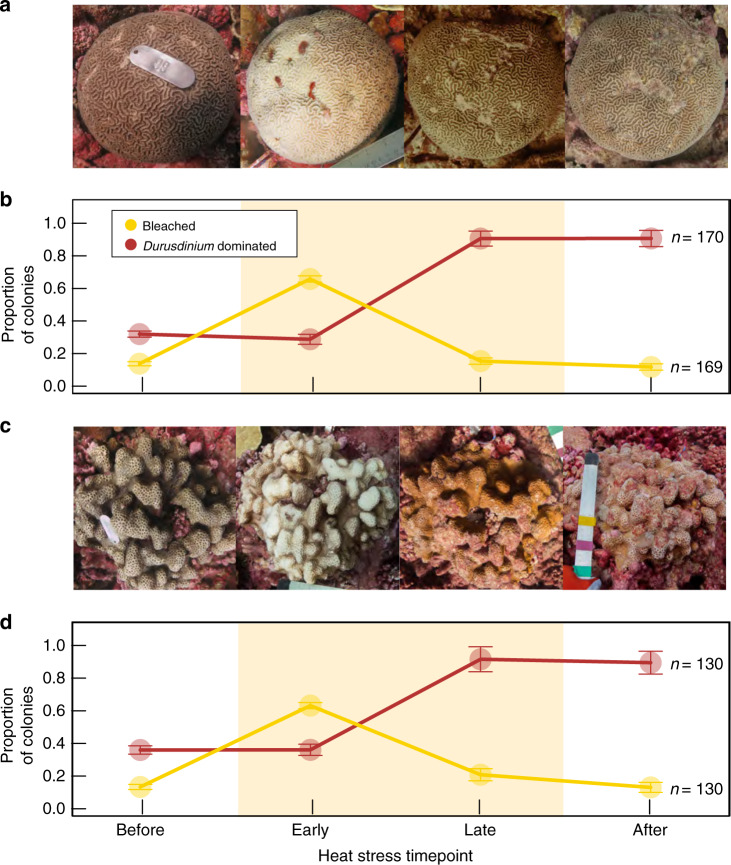
Fig. 3. Progression (healthy–bleached–recovered) of coral colonies during the 2015–2016 El Niño.
a, c Examples of single tracked coral colonies of a P. ryukyuensis and c Favites pentagona that bleached and recovered during the heatwave. b, d Proportion of coral colonies of b P. ryukyuensis and d F. pentagona that were dominated by heat-tolerant symbionts (>50% Durusdinium sequence reads) and proportion that were bleached (mean ± 95% CI), at time points spanning from before to after the El Niño-induced heat stress: before = the most recent time point before the heatwave (i–iii), early (iv), late (vi), and the most recent time point after the event (vii, viii). Expedition time points correspond to those in Figs. 2 and 4. Sample sizes refer to total number of samples (bleaching status or symbiont identities) taken from coral colonies across all time points. Shaded pale yellow areas in b and d correspond to >4 degree heating weeks from Fig. 2.

