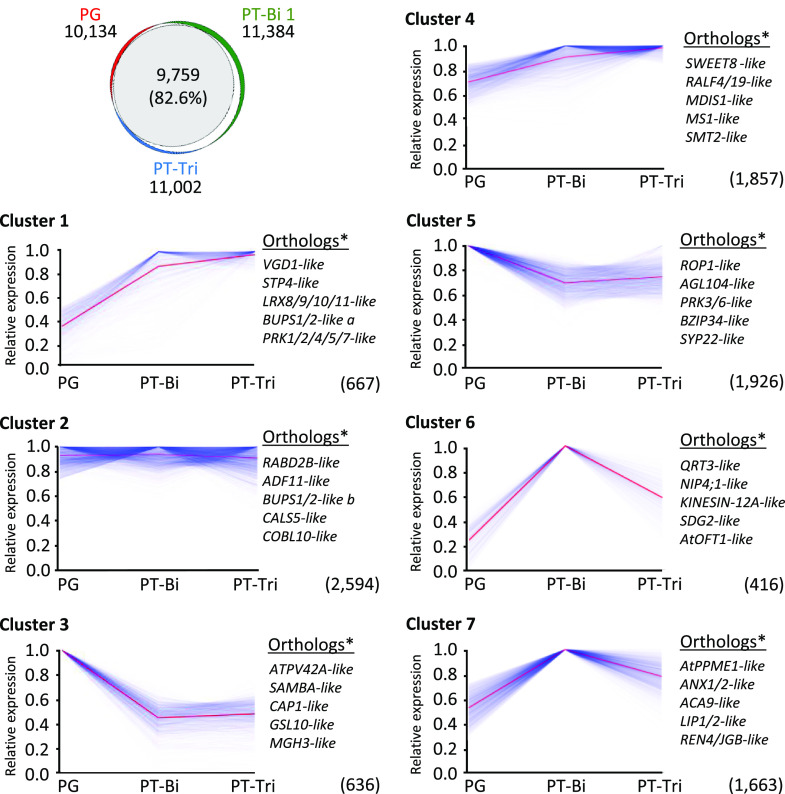
Figure 5.
Cluster analysis to visualize transcriptome dynamics during transition from PGs to tricellular PTs in A. trichopoda. Top left, Venn diagram showing overlap between genes expressed in PGs, PT-Bi, and PT-Tri. Only genes with TPM values ≥ 1 in all replicates from a given tissue are considered. 9,759 genes expressed in all samples can be subdivided in seven k-mean clusters. y axis shows scaled gene expression values obtained for each gene by dividing its TPM value by the maximum value among the three samples. Total number of genes represented by each cluster are shown in brackets. Blue lines represent individual genes and average expression of genes in a given cluster is indicated with a red line. Orthologs* indicates the presence of the top five putative orthologs of Arabidopsis genes with known pollen function. A full list of genes in the k-mean clusters is shown in Supplemental Table S5.

