Figure 7.
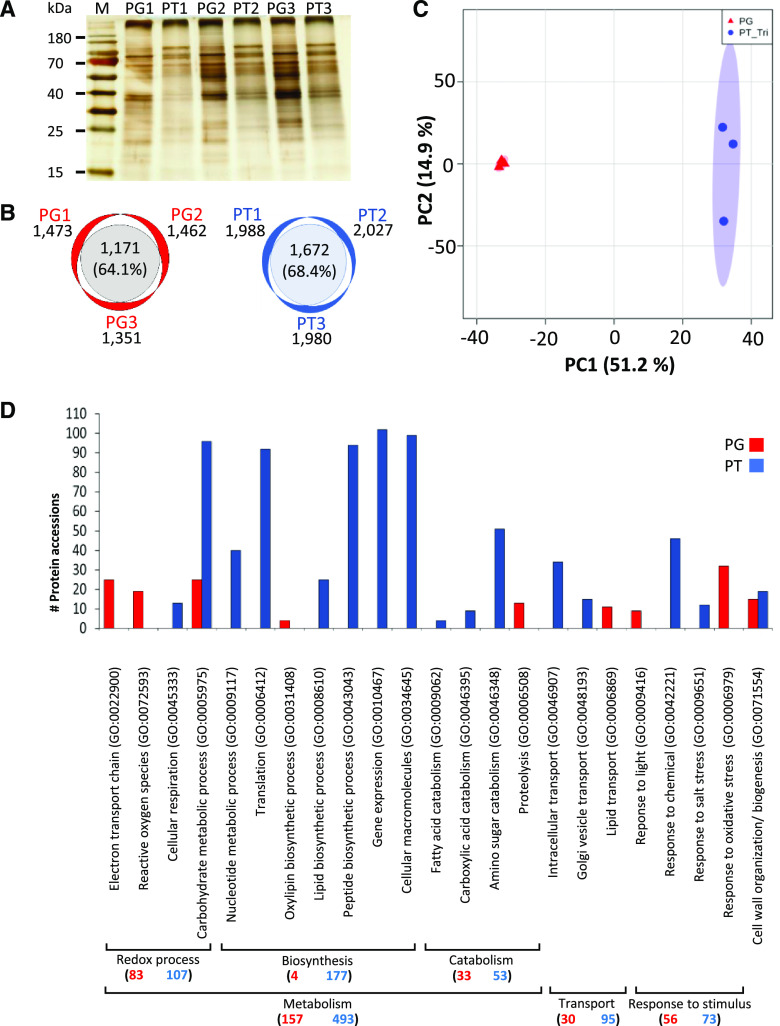
Proteomic analysis of PGs and tricellular PT from A. trichopoda. A, Characteristic protein pattern observed for PG and PT 17 h after germination. Prior to MS, protein samples of each of the three biological replicates were quality checked by silver staining after SDS-PAGE. B, Number of proteins detected by MS in three biological replicates of PGs and PTs. C, PCA plot of proteins detected within three biological replicates of PG and PT samples. D, Functional category distribution according to biological processes of identified proteins that were significantly upregulated in PG (red) and PT (blue; P < 0.05). x axis represents significantly enriched gene ontology (GO) terms (false discovery rate < 0.05), while y axis represents the number of protein accessions in each GO term. GO categories were made by using PANTHER web service version 14.1. Numbers in brackets indicate total number of proteins found in PG or PT for a given main biological process. Corresponding detailed information is listed in Supplemental Tables S8 and S9.

