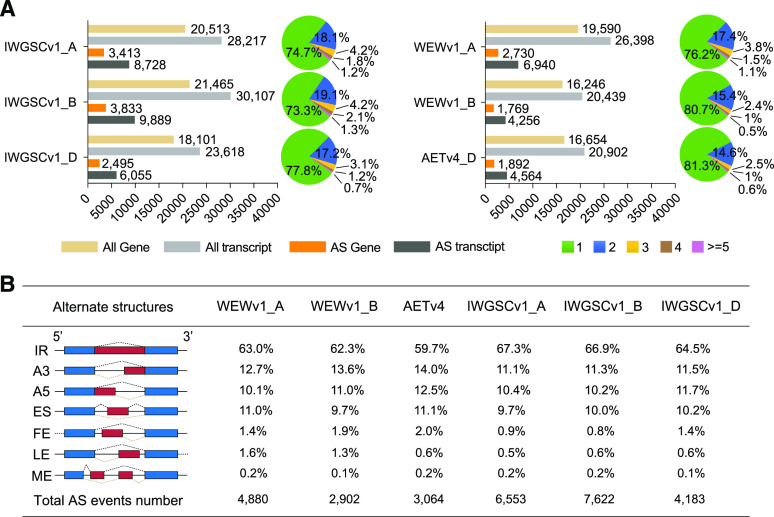
Figure 1.
AS event identification in wheat species with different ploidies. A, Column diagram shows the number of assembled genes (yellow), transcripts (light gray), alternative spliced genes (orange), and AS transcripts (dark gray) on each subgenome. Pie charts represent the proportion of total assembled genes with single-transcript or multi-transcripts. Green, blue, yellow, brown, and purple indicate genes with one, two, three, four, and greater than five transcripts. B, Structural sketches of different AS events and their corresponding number and proportion on each subgenome.

