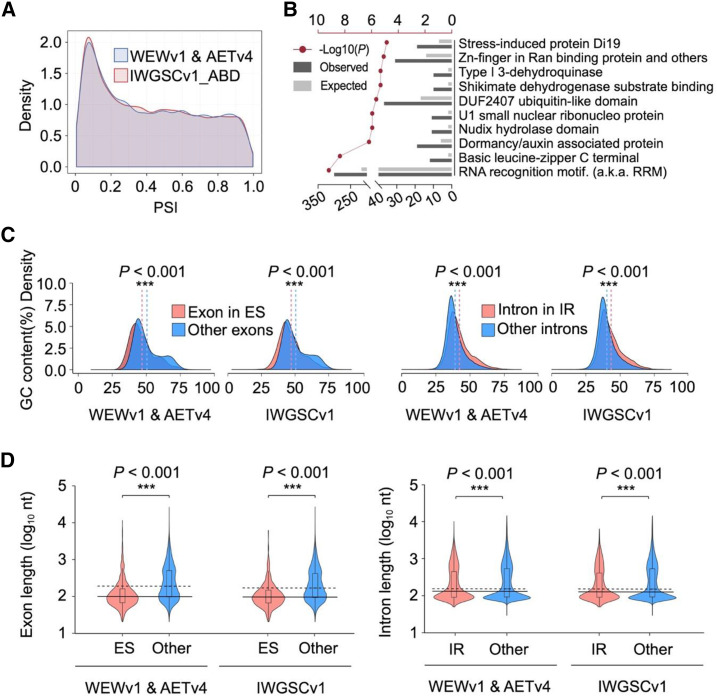
Figure 2.
Characterization of ASGs in wheat species with different ploidies. A, Density distribution of PSI of AS events. A large portion of ASGs with low PSI values indicate that these genes express one major transcript. B, The top-10 significantly enriched Pfam domains in ASGs ranked by hypergeometric test. Red broken line represents calculated –log10 (P value). Dark gray and light gray bars represent the observed and the expected ASG number, respectively. C, Density distribution of GC content between skipped exons (1,395) and other exons (328,525), as well as between retained introns (9,226) and other introns (249,641). The vertical dashed lines represent the average value of the data corresponding to each color. D, The comparison of length of skipped exons (1,395) and other exons (328,525) as well as retained introns (9,226) and other introns (249,641). The horizontal solid line represents the median length of the exon or intron in the AS event, and the horizontal dashed line represents the median length of counterparts. Asterisks indicate significant difference by Student’s t test (***P < 0.001).

