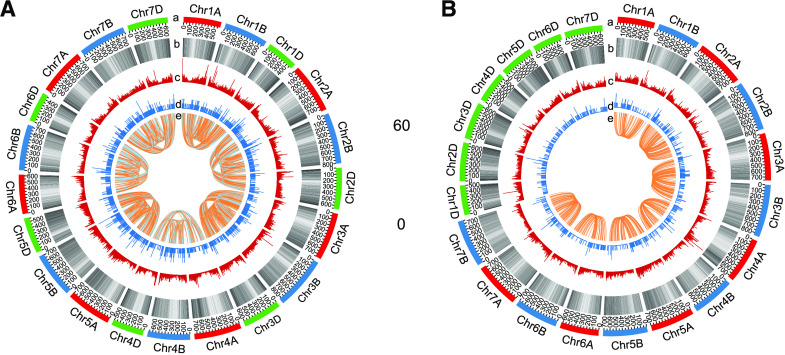
Figure 3.
Chromosome distribution of ASGs in wheat species with different ploidies. A and B, Chromosome distribution of ASGs in hexaploid wheat (A) as well as in diploid and tetraploid wheat species (B). Lane a, chromosome visualization. Lane b, chromosome distribution of high-confidence annotated genes per megabit from reference genome. Lane c, density histogram of assembled genes per 500 kb from our transcriptome sequencing data. Lane d, distribution of ASGs per 500 Kb along chromosome. Lane e, conservation of AS between homeologous genes. Orange line in A indicates that AS patterns are conserved among all three homoeologs of hexaploid. Gray line in A indicates that AS patterns are conserved in only two homeologs of hexaploid. Orange line in B represents that AS patterns are conserved in tetraploid wheat.

