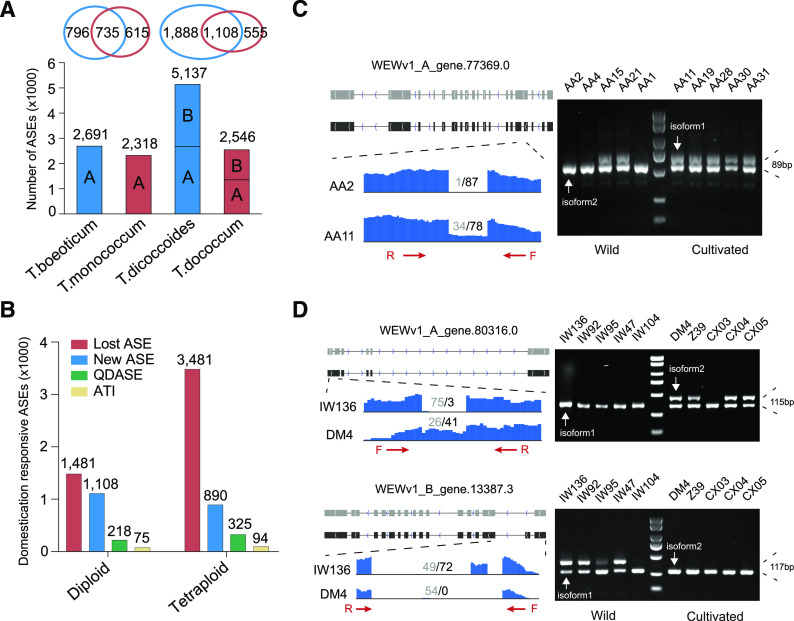
Figure 4.
AS changes in diploid and tetraploid wheat. A, Histogram showing the number of AS events in T. boeoticum (AA2), T. monococcum (AA11), T. dicoccoides (IW136), and T. dicoccum (DM4). The Venn diagram at the top shows the comparison of ASGs between diploid or tetraploid wheat. B, The number of AS events in response to domestication in diploid and tetraploid wheat, including lost AS events (red), new AS events (blue), QDASE (green), and ATI (tan) after domestication. C, Display and validation of AS changes in response to domestication in diploid wheat. AA2, AA4, AA15, AA21, and AA1 represent wild diploid accessions, whereas AA11, AA19, AA28, AA30, and AA31 represent domesticated diploid wheat accessions. D, Display and validation of AS changes in response to domestication in tetraploid wheat. IW136, IW92, IW95, IW47, and IW104 represent wild tetraploid accessions, whereas DM4, Z39, CX03, CX04, and CX05 represent domesticated tetraploid wheat. The gray (isoform1) and black (isoform2) squares in the upper representation represent the structure and transcriptional direction of different isoforms of ASGs. The lower representation shows the results of RNA-seq data mapping at gene splicing sites and the number of normalized junction supporting reads of different isoforms. The red arrows represent the location and direction of primers (F, forward; R, reverse) designed for RT-PCR, and agarose gel electrophoresis on the right verifies the AS.

