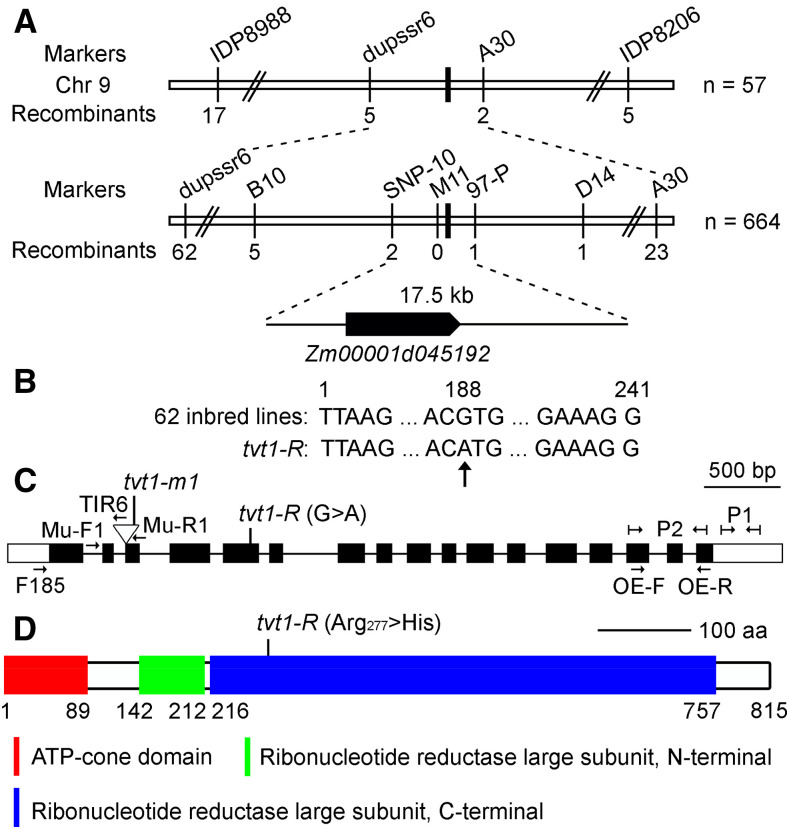
Figure 4.
Mapping of Tvt1. A, Schematic diagram of the map-based cloning of the Tvt1 gene. The gene was localized to a 17.5-kb region on chromosome 9, which contains only one gene, Zm00001d045192. B, The G-to-A transition in exon 5 of Zm00001d045192 detected using Sanger sequencing. The nucleotide at the variation site is absolutely conserved in 62 maize inbred lines. The numbers showing the nucleotide position are equivalent to exon 5 of Zm00001d045192. C, Diagram showing the Zm00001d045192 gene structure and the position of the mutant alleles. Boxes represent exons (black boxes and white boxes indicate translated regions and untranslated regions, respectively), and lines represent introns. Primers in the diagram were designed for the following studies. Mu-F1, Mu-R1, and TIR6 were used to detect the Mu insertion type. P1 was designed for expression analysis of Tvt1, and P2 was designed to measure the relative expression level of Tvt1 in homozygous overexpression lines. A pair of specific primers (F185 + Mu-R1) was used to amplify the Mu transcript. A pair of intron-spanning primers (OE-F and OE-R) was designed to detect the overexpression of Tvt1 at the DNA level. D, Schematic diagram of ZmRNRL1 protein structure. aa, amino acids. The G-to-A point mutation in tvt1-R leads to a change in the 277th amino acid from Arg to His.

