Figure 5.
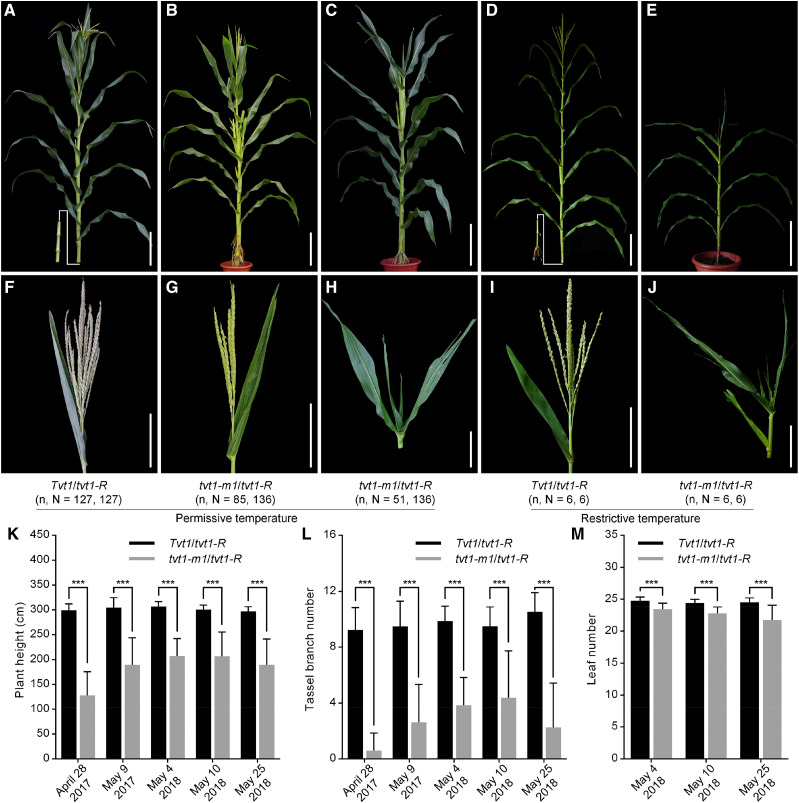
Allelism test. A to E, Plant morphology of F1 progeny generated by crossing heterozygous tvt1-m1 mutants (Tvt1/tvt1-m1) with tvt1-R mutants. Scale bars = 30 cm. F to J, Shoot apex phenotypes of the plants shown in A to E. Scale bars = 15 cm. n represents the number of plants with the corresponding phenotype, and N represents the number of plants with the corresponding genotype. The plants were digitally extracted for comparison. K to M, Comparisons of plant height (K), tassel branch number (L), and leaf number (M) between Tvt1/tvt1-R and tvt1-m1/tvt1-R plants. April 28, 2017, May 9, 2017, May 4, 2018, May 10, 2018, and May 25, 2018 represent the five sowing dates in Beijing in the summer. Values are means ± sd. Two-tailed Student’s t test was used to detect significant differences (***P < 0.001).

