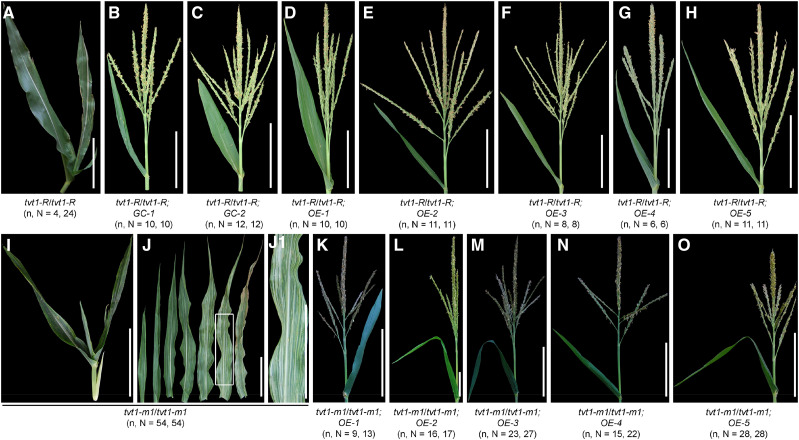
Figure 6.
Complementation tests. A to H, Shoot apex phenotypes of F2 progenies derived from crosses between the seven transgenic lines and the tvt1-R mutant at restrictive temperatures. I to O, Shoot apex or leaf phenotypes of F2 offsprings generated from crosses between the five overexpression lines and heterozygous tvt1-m1 mutants (Tvt1/tvt1-m1) at permissive temperatures. J1, Magnification of the white box in J. Scale bars = 15 cm. n represents the number of plants with the corresponding phenotype, and N represents the number of plants with the corresponding genotype. The plants were digitally extracted for comparison.

