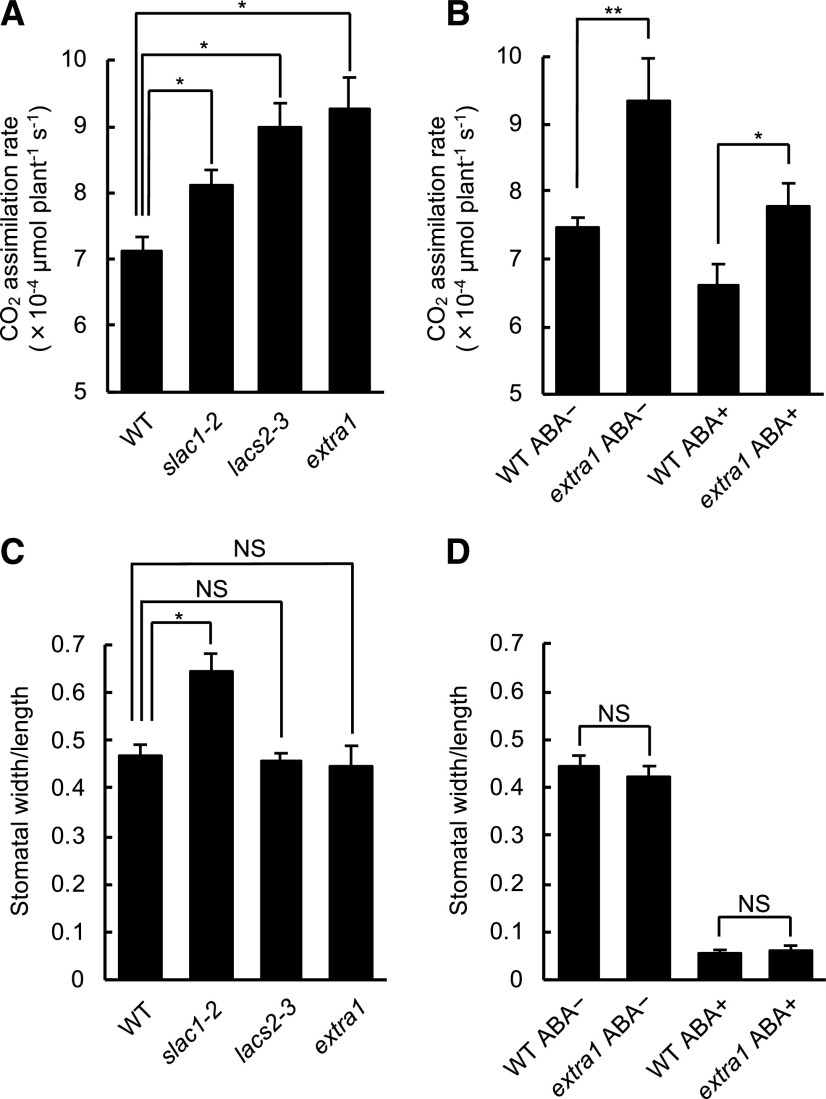
Figure 3.
The extra1 mutant demonstrated a high CO2 assimilation rate. A and C, The CO2 assimilation rates per individual plant (A) and stomatal apertures as indicated by the ratio of width/length (C) of wild type (WT), slac1-2, lacs2-3, and extra1 are shown. Data presented are means ± se (n ≥ 6). Asterisks indicates statistical significance by Dunnett’s test (*P < 0.05). B and D, The CO2 assimilation rates per individual plant (B) and stomatal apertures as indicated by the ratio of width/length (D) of wild type and extra1, treated with 1 mm of ABA or mock (0.1% [v/v] DMSO). Data presented are means ± se (n ≥ 6). Asterisks indicates statistical significance by Student’s t test (*P < 0.05 and **P < 0.01). The CO2 concentration (400 μL L–1), light intensity (60 μmol m–2 s–1), and humidity condition (95%) were kept constant throughout the measurement of the CO2 assimilation rate. The stomatal apertures were measured just after measuring the CO2 assimilation rate. NS, Not significant.

