Figure 5.
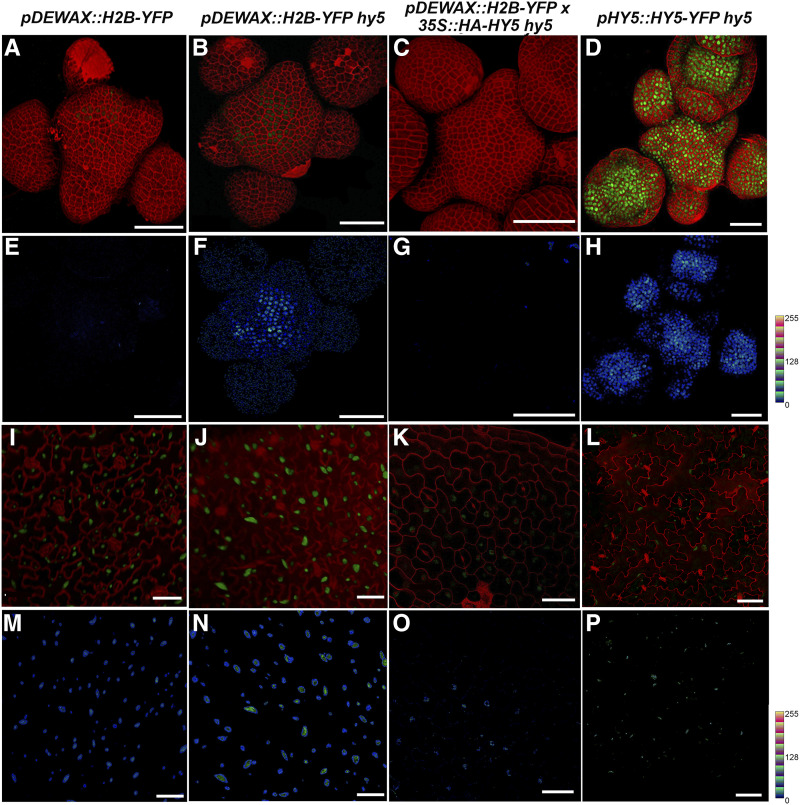
HY5 negatively regulates DEWAX. A to D, Reconstructed views of the L1-layer of SAM expressing pDEWAX::H2B-YFP (green) in wild-type Ler (A), the hy5 mutant (B), and 35S::HA-HY5 hy5 (C), and expressing HY5-YFP (green) in the hy5 mutant (D). Cell outlines were stained with PI (red). E to H, Quantification of YFP is depicted for the wild type (E), hy5 (F), 35S::HA-HY5 hy5 (G), and pHY5::HY5-YFP hy5 (H). Intensity plots were made using the LUT command in Fiji (0–256 scale represents gray values based on the LUT). I to L, Reconstructed views of the leaf epidermis showing expression of pDEWAX::H2B-YFP in wild-type Ler (I), hy5 (J), and 35S::HA-HY5 hy5 (K), and expression of pHY5::HY5-YFP hy5 in the mutant (L). M to P, Quantification of YFP was carried out in the wild type (M), hy5 (N), 35S::HA-HY5 hy5 (O), and pHY5::HY5-YFP hy5 (L) lines using Fiji. Quantification of HY5-YFP based on LUT in the SAM (H) and leaf epidermis (P) suggests relatively high activity of pHY5 in the SAM compared to leaf epidermis. Scale bars = 40 μm.

