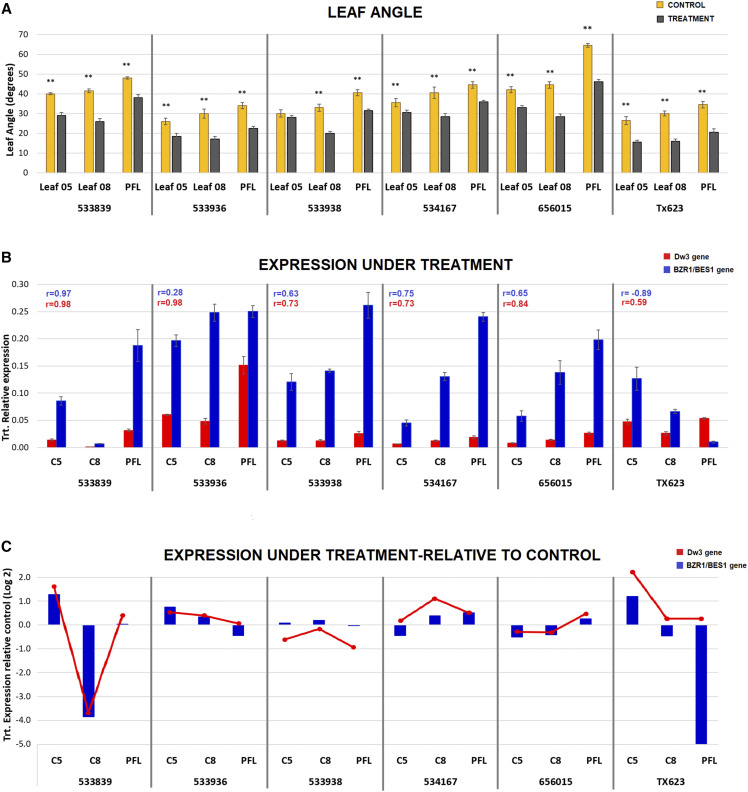
Figure 6.
Phenotypic and gene expression response to the BR inhibitor pcz. A, Leaf angle under control and pcz treatment. Asterisks indicate significance by ANOVA (**P < 0.01). B, RT-qPCR expression profiles of BZR1/BES1 and Dw3 under treatment calculated as 2-ΔCT. Pearson correlation values were calculated between expression levels of each gene (indicated by colors) and the corresponding leaf angle after pcz treatment. C, RT-qPCR expression profiles of BZR1/BES1 and Dw3 under treatment relative to control calculated as 2−ΔΔCT. Negative values indicate lower expression than under control conditions. C5, C8, and CPFL (leaves counted from bottom to top). Trt., pcz treatment at 50 μm. Error bars indicate se (n = 3).

