Figure 1.
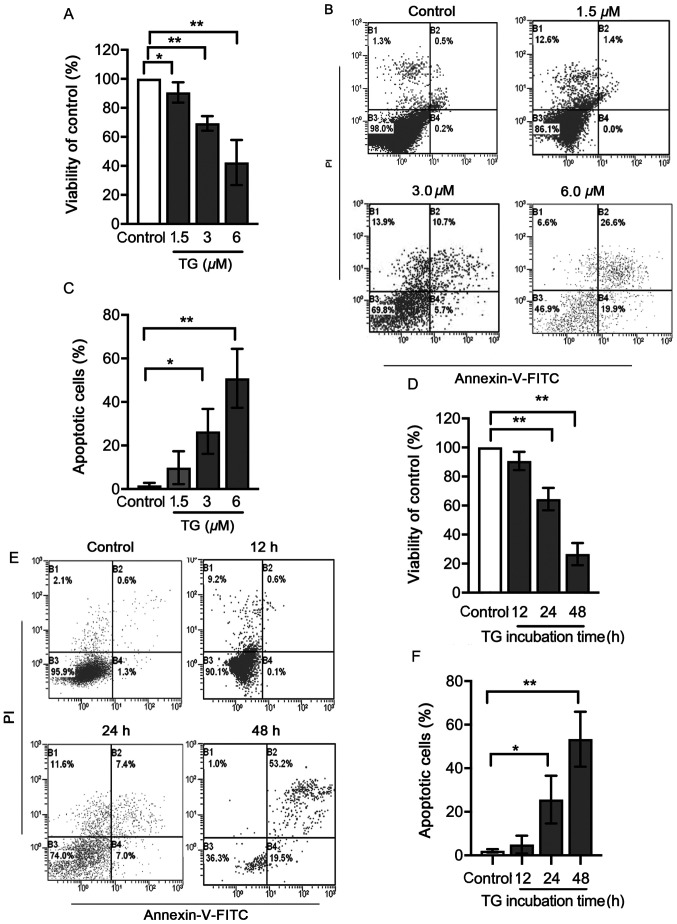
Viability and apoptosis of cells treated with TG. Cultured neonatal rat cardiomyocytes were left untreated or treated with 1.5, 3 or 6 µM TG for 24 h. Following this, (A) cell viability was determined using an MTT assay, (B) apoptosis was determined using flow cytometry and (C) the rates of apoptotic cells are presented in bar graphs. Cultured neonatal rat cardiomyocytes were left untreated or treated with 3 µM TG for 12, 24 or 48 h. Following this, (D) cell viability was determined using an MTT assay. (E) Apoptosis was assessed using flow cytometry analysis and (F) the rates of apoptotic cells are presented in bar graphs. In the flow cytometry plots, the horizontal axis represents the Annexin V intensity, and the vertical axis represents PI staining. Lower left quadrant, living cells; upper left quadrant, necrotic cells; right quadrants, apoptotic cells. All data on dose response and time series were analyzed with a one-way ANOVA followed by a Tukey's test. Data are presented as the mean ± SD. n=3. *P<0.05 and **P<0.01. TG, thapsigargin; PI, propidium iodide.

