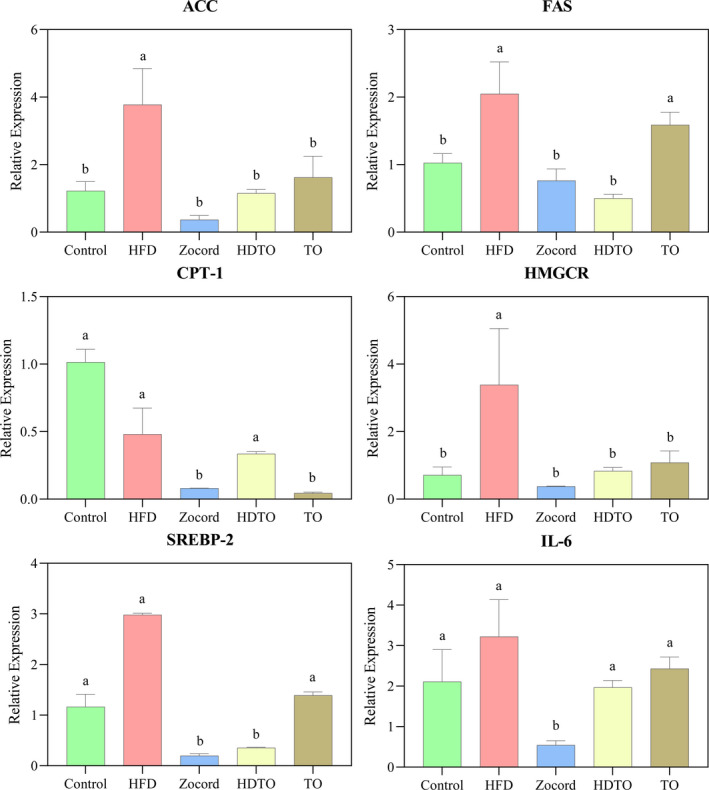
Figure 3.

Effects of HDTO and TO supplementation on the relative expression of ACC, FAS, CPT‐1, HMGCR, SREBP‐2, and IL‐6 in the liver. The values are expressed as means ± SEM, and the different letters represent significant differences between different groups (p < .05)
