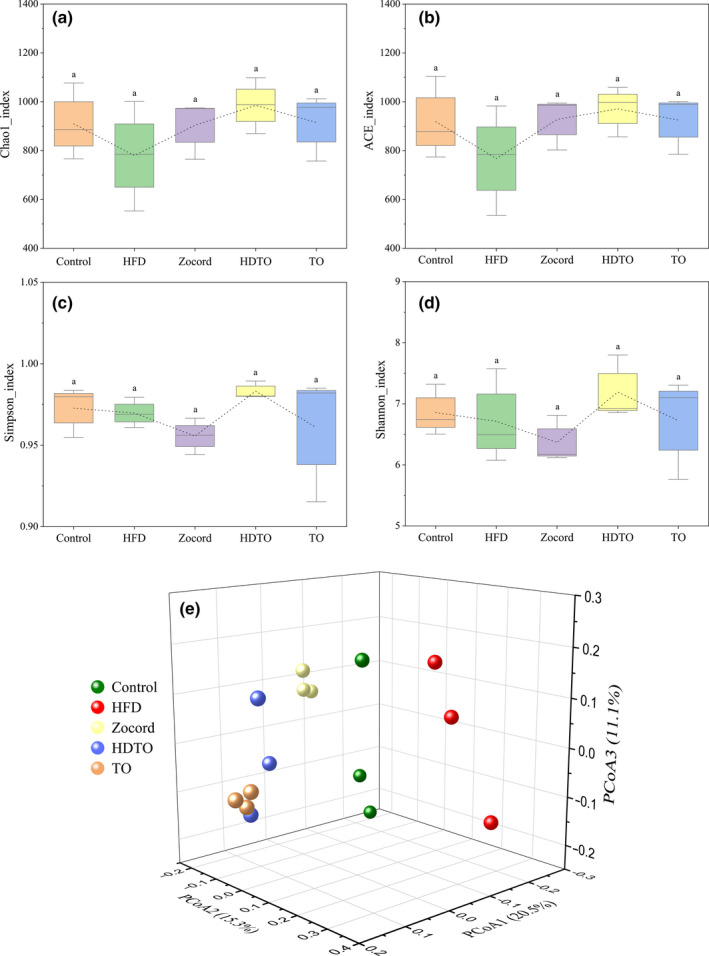
Figure 4.

Alpha diversity analysis of (a) Chao1, (b) ACE, (c) Simpson, and (d) Shannon indices. (e) Principal coordinate analysis (PCoA) on the OTU level based on the unweighted Unifrac distance. The values are expressed as the means ± SD, and the different letters represent significant differences between different groups (p < .05)
