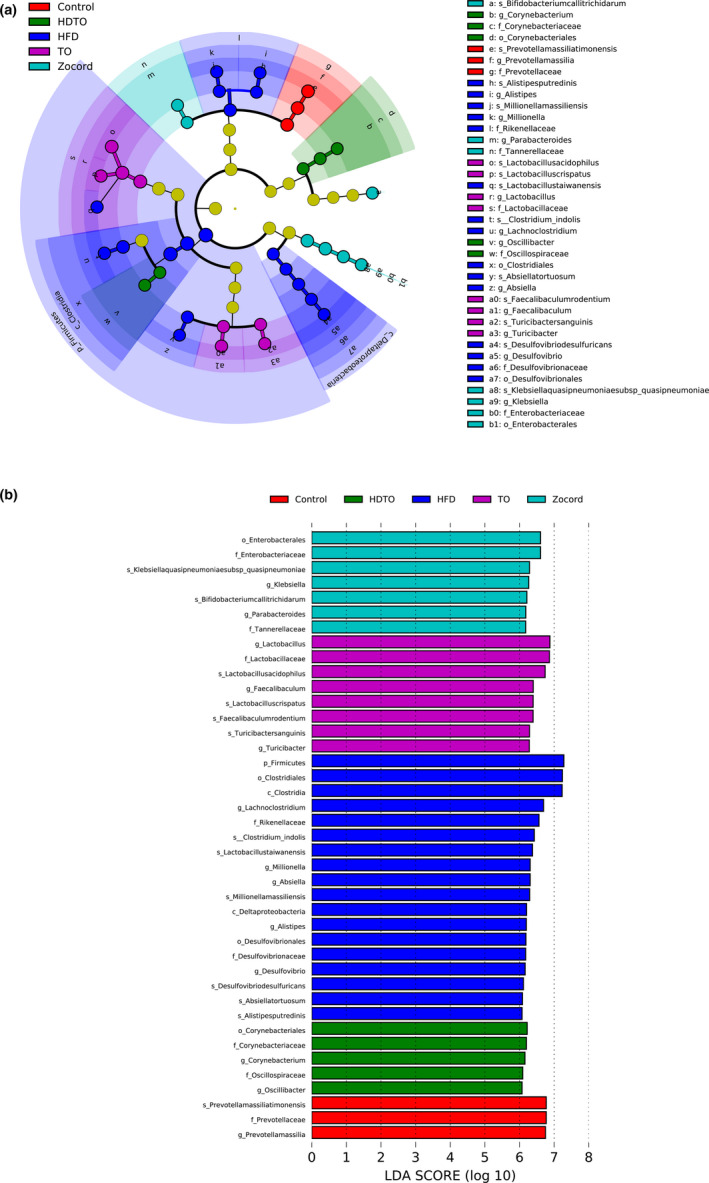
Figure 6.

Key phylotypes of gut microbiota corresponding to HDTO and TO supplementation. LDA effect size (LEfSe) was performed to identify the different abundant taxa (LDA score was 6.0). (a) The cladograms show the most differently abundant taxa enriched in the microbiota. (b) The histograms show the LDA scores calculated for characteristics
