
FIGURE 3.
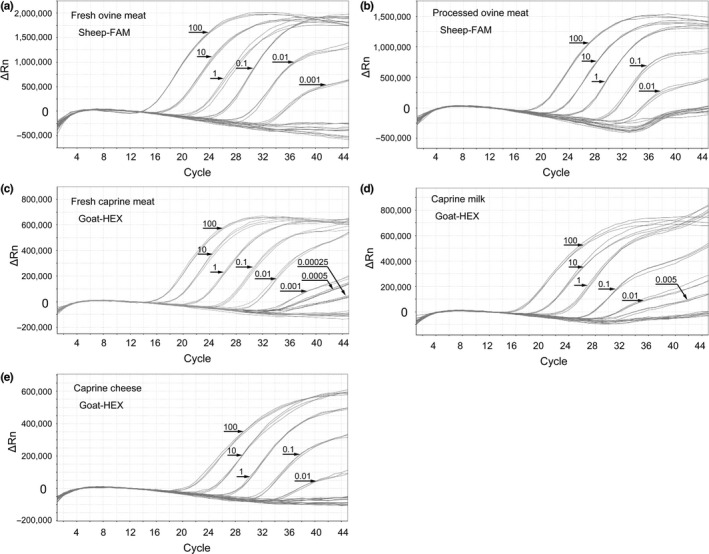
Real‐time PCR amplification plots for the gradient dilution of DNA extracted from fresh ovine meat (a), processed ovine meat (b), fresh caprine meat (c), caprine milk (d), and caprine cheese (e)
Official websites use .gov
A
.gov website belongs to an official
government organization in the United States.
Secure .gov websites use HTTPS
A lock (
) or https:// means you've safely
connected to the .gov website. Share sensitive
information only on official, secure websites.
Real‐time PCR amplification plots for the gradient dilution of DNA extracted from fresh ovine meat (a), processed ovine meat (b), fresh caprine meat (c), caprine milk (d), and caprine cheese (e)