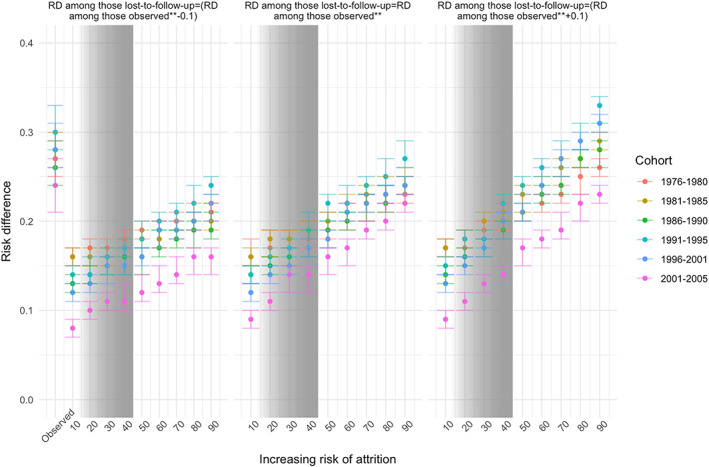
FIGURE 3.

Bias analysis for RDs with imputation of a range of possible age 29/30 binge drinking statuses among those lost to follow‐up by age 29/30 differentially by twelfth grade binge drinking status, fixing the RD among those lost to follow‐up as equal to the observed RD [center panel], less than observed RD [left panel], and greater than observed RD [right panel]. RD, risk difference
