Figure 2.

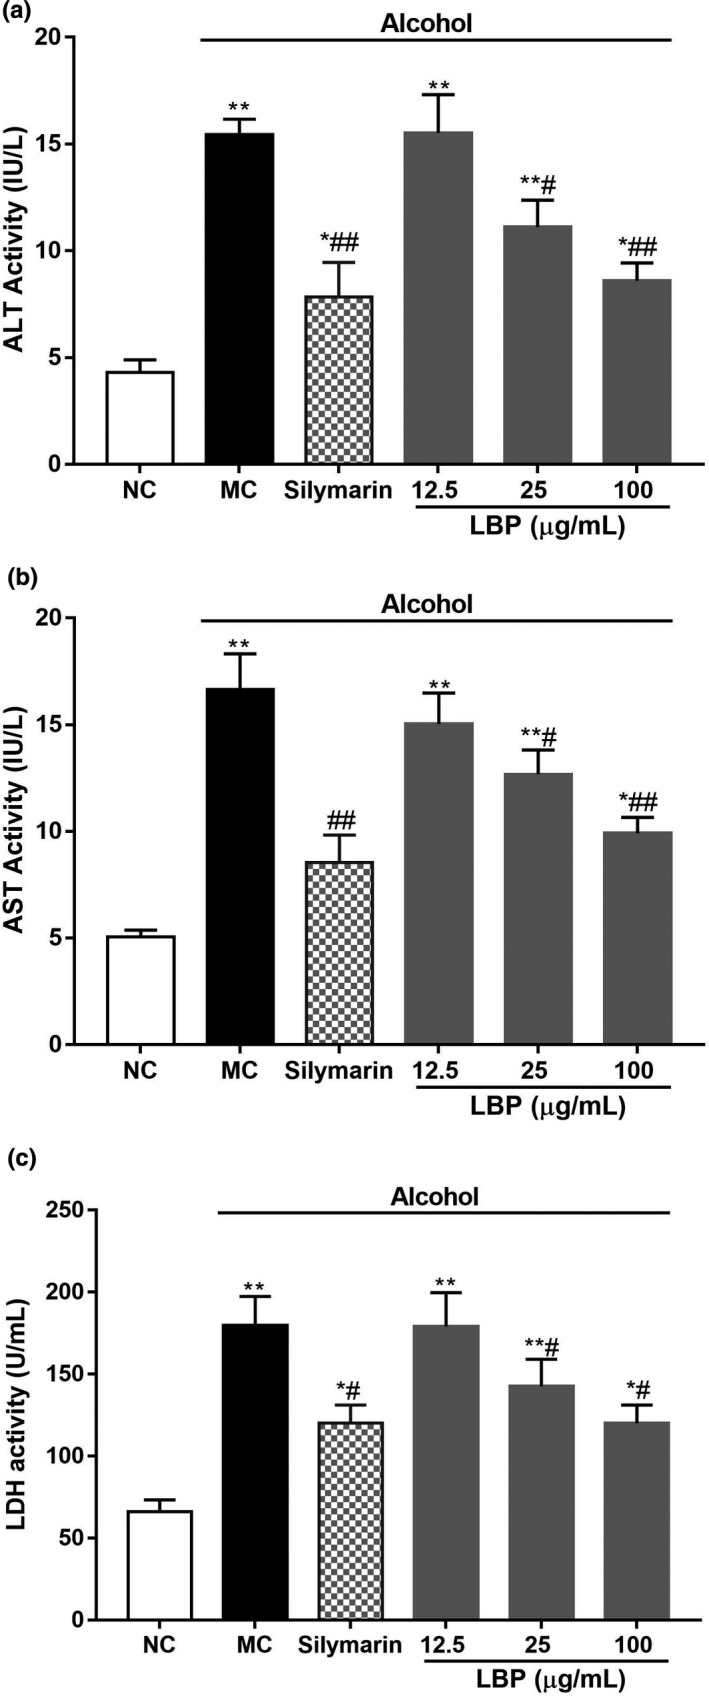
The effect of LBPs on alcohol‐induced hepatic enzyme release in alcohol induced L‐02 cells (a) ALT, (b) AST, (c) LDH (n = 6). Compared with the NC group *p < .05, **p < .01; compared with the MC group # p < .05, ## p < .01

The effect of LBPs on alcohol‐induced hepatic enzyme release in alcohol induced L‐02 cells (a) ALT, (b) AST, (c) LDH (n = 6). Compared with the NC group *p < .05, **p < .01; compared with the MC group # p < .05, ## p < .01