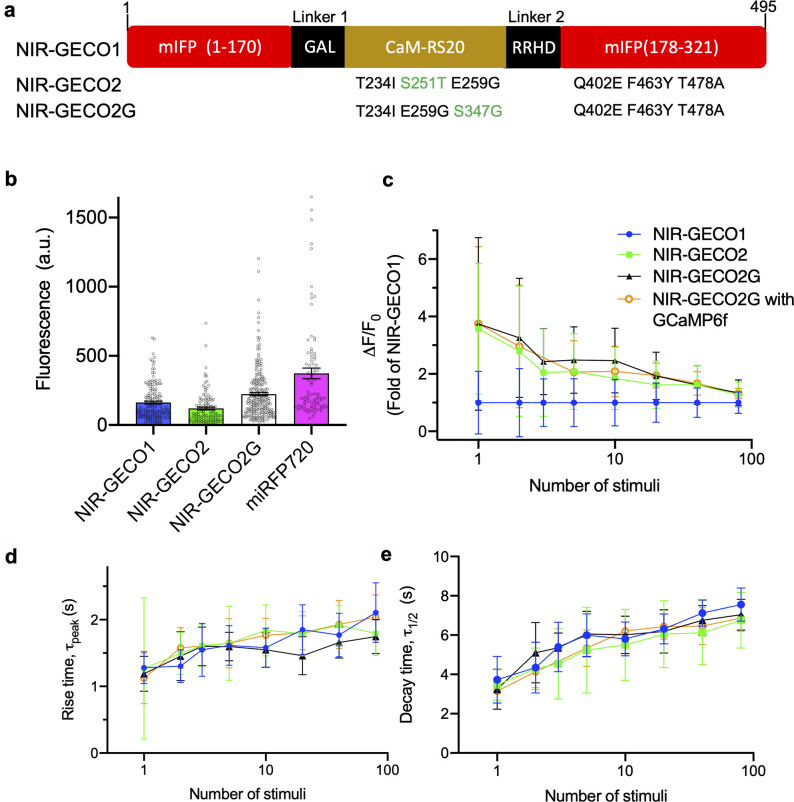
Fig 1. NIR-GECO evolution and characterization in dissociated neurons.
(a) Mutations of NIR-GECO2 and NIR-GECO2G relative to NIRGECO1. The different mutations between NIR-GECO2 and NIR-GECO2G are highlighted in green. (b) Relative fluorescence intensity (mean ± SEM) of NIR-GECO1, NIR-GECO2, NIR-GECO2G, and miRFP720 in neurons (n = 160, 120, 219, and 84 neurons, respectively, from 2 cultures). Fluorescence was normalized by co-expression of GFP via self-cleavable 2A peptide. (c–e) Comparison of NIR-GECO variants, as a function of stimulus strength (the same color code is used in panels c–e). (c) ΔF/F0; (d) rise time; (e) half decay time. Values are shown as mean ± SD (n = 10 wells from 3 cultures). The underlying data for (b) to (e) can be found in S1 Data. GFP, green fluorescent protein; NIR, near-infrared; SD, standard deviation; SEM, standard error of the mean.

